前言
本篇文章将继续和大家一起深入学习 WebGL。
绘制多点
首先咱们先从概念上疏通一下。
我们在用 js 定点位的时候,肯定是要建立一份顶点数据的,这份顶点数据是给谁的呢?肯定是给着色器的,因为着色器需要这份顶点数据绘图。
然而,我们在 js 中建立顶点数据,着色器肯定是拿不到的,这是语言不通导致的。
为了解决这个问题,webgl 系统就建立了一个能翻译双方语言的缓冲区。js 可以用特定的方法把数据存在这个缓冲区中,着色器可以从缓冲区中拿到相应的数据。
接下来咱们就看一下这个缓冲区是如何建的,着色器又是如何从其中拿数据的。
绘制多点逻辑
1.建立顶点数据,两个浮点数构成一个顶点,分别代表 x、y 值
1
2
3
4
5
6
| const vertices = new Float32Array([
0.0, 0.1,
-0.1,-0.1,
0.1, -0.1,
]);
|
现在上面的这些顶点数据是存储在 js 缓存里的,着色器拿不到,所以咱们需要建立一个着色器和 js 都能进入的公共区。
2.建立缓冲对象
1
| const vertexBuffer = gl.createBuffer();
|
现在上面的这个缓冲区是独立存在的,它只是一个空着的仓库,和谁都没有关系。接下来咱们就让其和着色器建立连接
3.绑定缓冲对象
1
| gl.bindBuffer(gl.ARRAY_BUFFER, vertexBuffer);
|
gl.bindBuffer(target,buffer) 绑定缓冲区
- target 要把缓冲区放在 webgl 系统中的什么位置
- buffer 缓冲区
着色器对象在执行 initShaders() 初始化方法的时候,已经被写入 webgl 上下文对象 gl 中了。
当缓冲区和着色器建立了绑定关系,我们就可以往这块空间写入数据了
4.往缓冲区对象中写入数据
1
| gl.bufferData(gl.ARRAY_BUFFER, vertices, gl.STATIC_DRAW);
|
bufferData(target, data, usage) 将数据写入缓冲区
1
2
| const a_Position = gl.getAttribLocation(gl.program, "a_Position");
gl.vertexAttribPointer(a_Position, 2, gl.FLOAT, false, 0, 0);
|
gl.vertexAttribPointer(local,size,type,normalized,stride,offset) 将缓冲区对象分配给 attribute 变量
- local attribute 变量
- size 顶点分量的个数,比如我们的 vertices 数组中,两个数据表示一个顶点,那咱们就写 2
- type 数据类型,比如 gl.FLOAT 浮点型
- normalized 是否将顶点数据归一
- stride 相邻两个顶点间的字节数,我的例子里写的是 0,那就是顶点之间是紧挨着的
- offset 从缓冲区的什么位置开始存储变量,我的例子里写的是 0,那就是从头开始存储变量
到了这里,着色就知道缓冲区的数据是给谁的了。因为咱们缓冲区里的顶点数据是数组,里面有多个顶点。所以我们得开启一个让着色器批量处理顶点数据的属性。默认着色器只会一个一个的接收顶点数据,然后一个一个的绘制顶点。
6.开启顶点数据的批处理功能
1
| gl.enableVertexAttribArray(a_Position);
|
gl.enableVertexAttribArray(local)
location attribute 变量
7.绘图
1
2
3
| gl.clearColor(0.0, 0.0, 0.0, 1.0);
gl.clear(gl.COLOR_BUFFER_BIT);
gl.drawArrays(gl.POINTS, 0, 3);
|
drawArrays(mode,first,count)
- mode 绘图模式,比如 gl.POINTS 画点
- first 从哪个顶点开始绘制
- count 要画多少个顶点
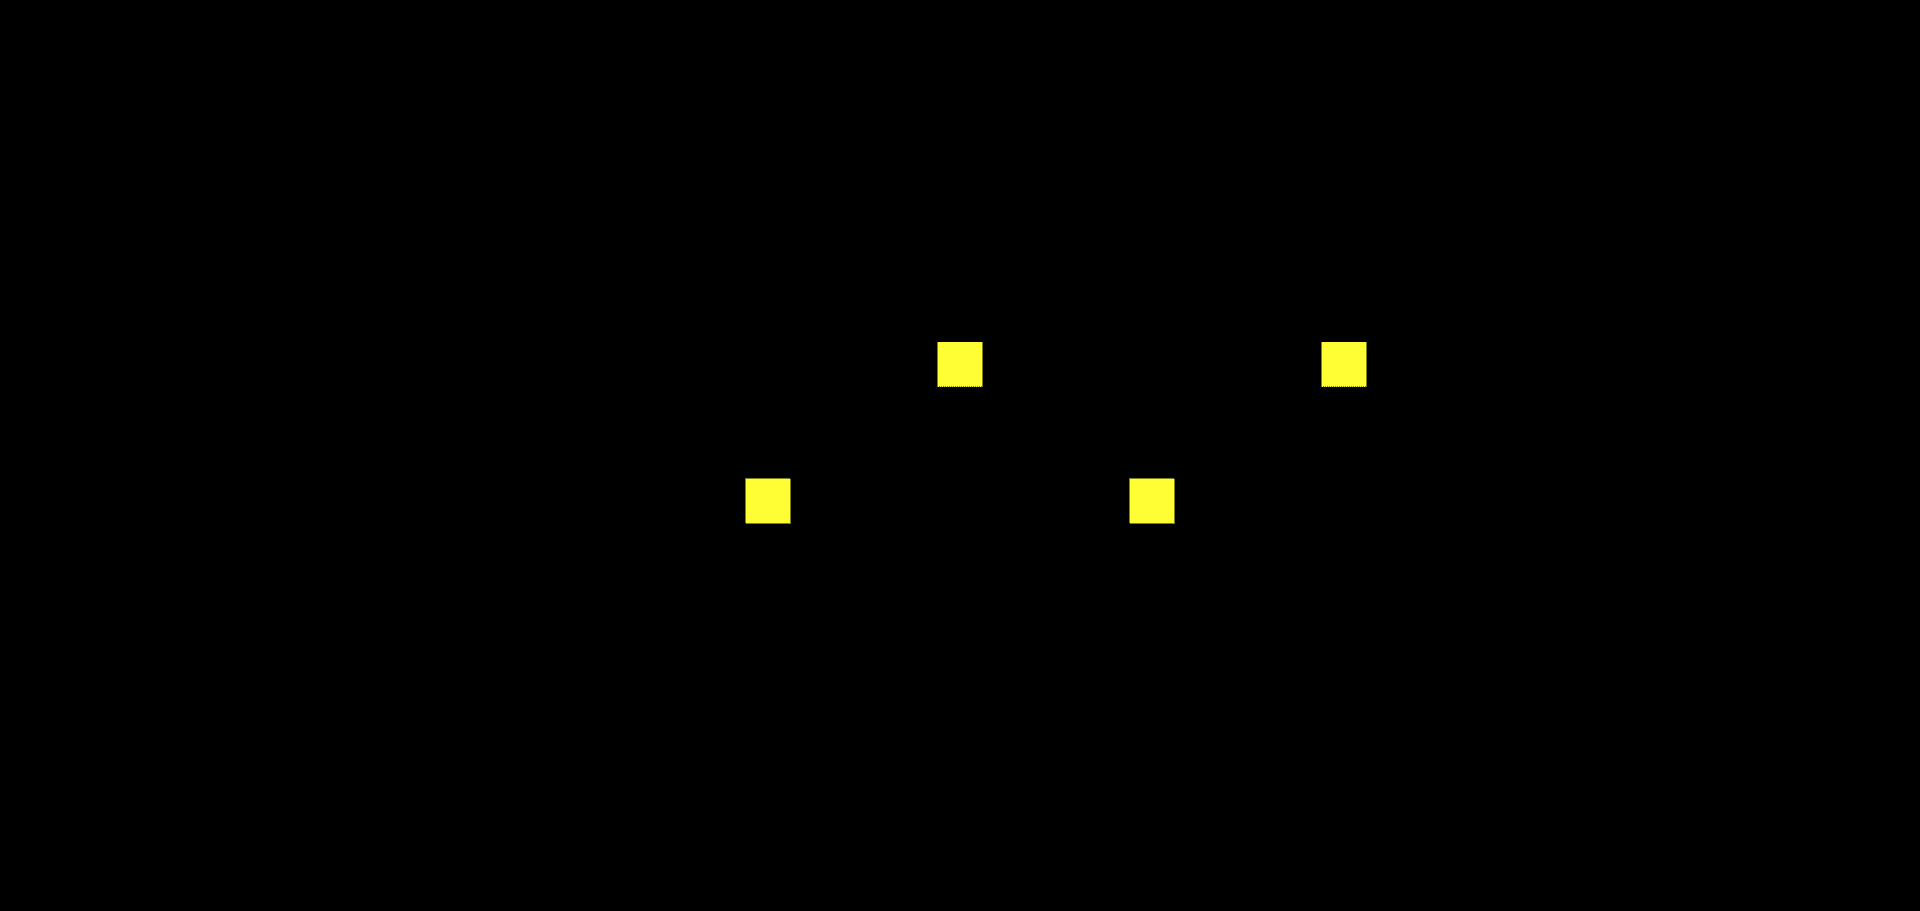
绘制多点代码
然后我们根据上面的逻辑写一份代码
1
2
3
4
5
6
7
8
9
10
11
12
13
14
15
16
17
18
19
20
21
22
23
24
25
26
27
28
29
30
31
32
33
34
35
36
37
38
39
40
41
42
43
44
45
46
47
48
49
50
51
52
53
54
55
56
57
58
59
60
61
62
63
64
65
66
67
68
69
70
71
72
73
74
75
76
77
78
79
80
| <!DOCTYPE html>
<html lang="en">
<head>
<meta charset="UTF-8" />
<title>绘制多点</title>
<style>
body {
margin: 0;
overflow: hidden;
}
#canvas {
background-color: antiquewhite;
}
</style>
</head>
<body>
<canvas id="canvas"></canvas>
<script id="vertexShader" type="x-shader/x-vertex">
attribute vec4 a_Position;
void main(){
gl_Position=a_Position;
gl_PointSize=50.0;
}
</script>
<script id="fragmentShader" type="x-shader/x-fragment">
void main(){
gl_FragColor=vec4(1,1,0,1);
}
</script>
<script type="module">
import { initShaders } from "../jsm/Utils.js";
const canvas = document.querySelector("#canvas");
canvas.width = window.innerWidth;
canvas.height = window.innerHeight;
const vsSource = document.querySelector("#vertexShader").innerText;
const fsSource = document.querySelector("#fragmentShader").innerText;
const gl = canvas.getContext("webgl");
initShaders(gl, vsSource, fsSource);
const vertices = new Float32Array([
0, 0.2, -0.2, -0.1, 0.2, -0.1, 0.4, 0.2,
]);
const vertexBuffer = gl.createBuffer();
gl.bindBuffer(gl.ARRAY_BUFFER, vertexBuffer);
gl.bufferData(gl.ARRAY_BUFFER, vertices, gl.STATIC_DRAW);
const a_Position = gl.getAttribLocation(gl.program, "a_Position");
gl.vertexAttribPointer(a_Position, 2, gl.FLOAT, false, 0, 0);
gl.enableVertexAttribArray(a_Position);
gl.clearColor(0, 0, 0, 1);
gl.clear(gl.COLOR_BUFFER_BIT);
gl.drawArrays(gl.POINTS, 0, 4);
</script>
</body>
</html>
|
WebGL 的绘图方式
之前我们一直讲的是如何绘制点,却从来没说过怎么绘制线和面,其实非常简单,只需要在 draw 的时候修改一下参数
我给大家个表格和图片来方便大家理解
| 参数名 |
图形 |
描述 |
| gl.POINTS |
点 |
一系列点,依次绘制 |
| gl.LINES |
线段 |
每两个一组绘制线段,若点的数目为奇数,最后一个点会被舍弃 |
| gl.LINES_STRIP |
线条 |
所有的点依次相连 |
| gl.LINE_LOOP |
回路 |
再线条的基础上,将首尾点相连 |
| gl.TRIANGLES |
三角形 |
每三个一组绘制三角形,若点的数目无法被三整除,剩余的点会被舍弃 |
| gl.TRIANGLES_STRIP |
三角带 |
一系列条带状的三角形,每个三角形都存在一条边共享 |
| gl.TRIANGLES_FAN |
三角扇 |
类似于扇形的图形 |
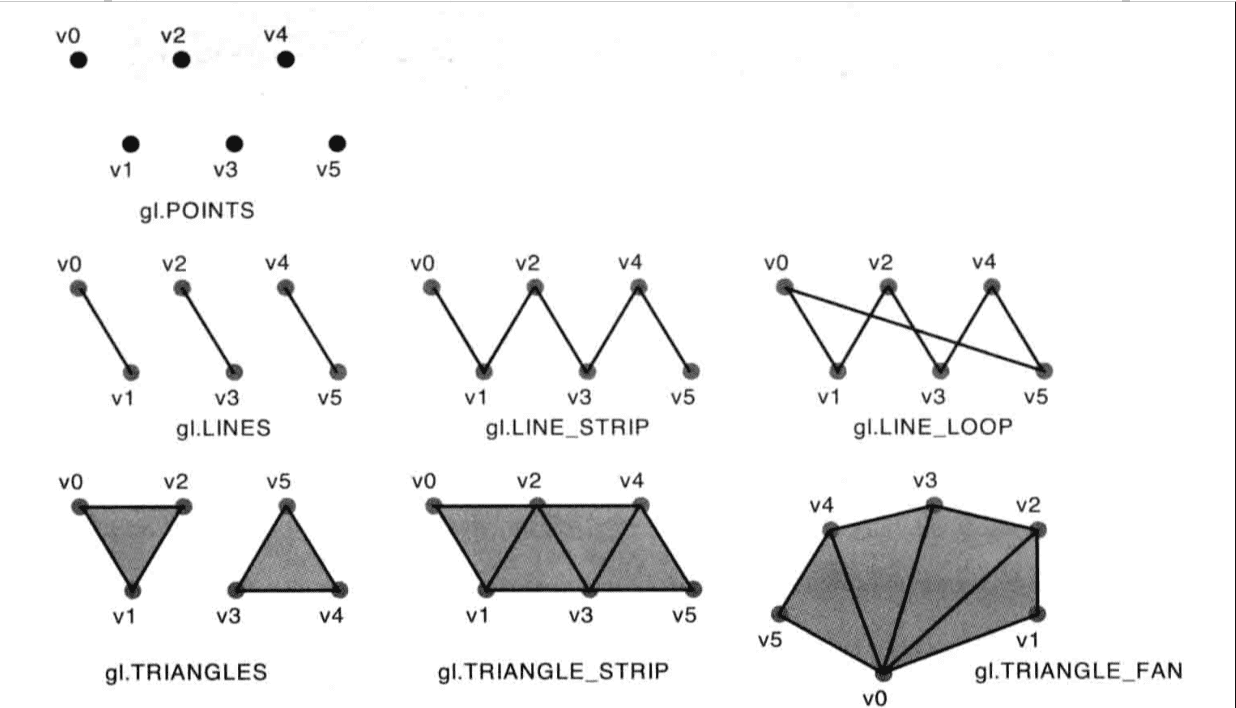
webgl 绘制图形的顺序
POINTS
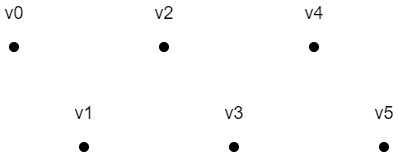
上面六个点的绘制顺序是:v0, v1, v2, v3, v4, v5
LINES
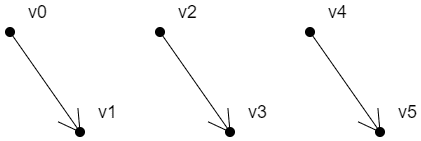
上面三条有向线段的绘制顺序是:
v0>v1
v2>v3
v4>v5
LINES_STRIP
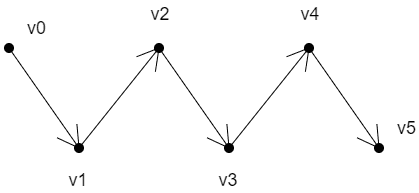
上面线条的绘制顺序是:v0>v1>v2>v3>v4>v5
LINE_LOOP
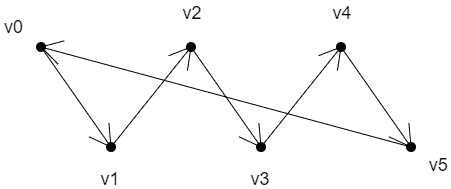
上面线条的绘制顺序是:v0>v1>v2>v3>v4>v5>v0
对于面的绘制,我们首先要知道一个原理:
面有正反两面。
面向我们的面,如果是正面,那它必然是逆时针绘制的;
面向我们的面,如果是反面,那它必然是顺时针绘制的;
TRIANGLES
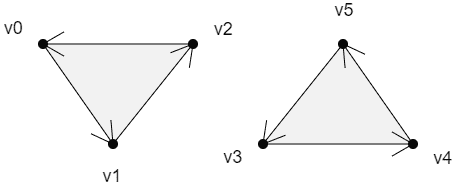
上面两个面的绘制顺序是:
v0>v1>v2
v3>v4>v5
TRIANGLE_STRIP
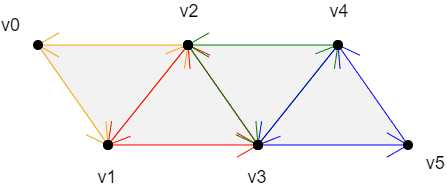
上面四个面的绘制顺序是:
v0>v1>v2
以上一个三角形的第二条边+下一个点为基础,以和第二条边相反的方向绘制三角形
v2>v1>v3
以上一个三角形的第三条边+下一个点为基础,以和第三条边相反的方向绘制三角形
v2>v3>v4
以上一个三角形的第二条边+下一个点为基础,以和第二条边相反的方向绘制三角形
v4>v3>v5
规律:
第一个三角形:v0>v1>v2
第偶数个三角形:以上一个三角形的第二条边+下一个点为基础,以和第二条边相反的方向绘制三角形
第奇数个三角形:以上一个三角形的第三条边+下一个点为基础,以和第三条边相反的方向绘制三角形
TRIANGLE_FAN
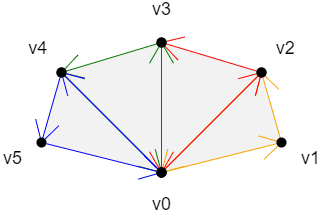
上面四个面的绘制顺序是:
v0>v1>v2
以上一个三角形的第三条边+下一个点为基础,按照和第三条边相反的顺序,绘制三角形
v0>v2>v3
以上一个三角形的第三条边+下一个点为基础,按照和第三条边相反的顺序,绘制三角形
v0>v3>v4
以上一个三角形的第三条边+下一个点为基础,按照和第三条边相反的顺序,绘制三角形
v0>v4>v5
规律:
第一个三角形:v0>v1>v2
以上一个三角形的第三条边+下一个点为基础,按照和第三条边相反的顺序,绘制三角形
绘制矩形
接下来我们用画面的三种方式,分别来绘制一下矩形
三角带
1
2
3
4
5
6
7
8
9
10
|
const vertices = new Float32Array(
[
-0.2, 0.2,
-0.2, -0.2,
0.2, 0.2,
0.2, -0.2
]);
gl.drawArrays(gl.TRIANGLE_STRIP, 0, 4);
|
三角扇
1
2
3
4
5
6
7
8
9
|
const vertices = new Float32Array([
-0.2, -0.2,
0.2, -0.2,
0.2, 0.2,
-0.2, 0.2
]);
gl.drawArrays(gl.TRIANGLE_FAN, 0, 4);
|
独立三角形拼矩形
1
2
3
4
5
6
7
8
9
10
11
12
|
const vertices = new Float32Array([
-0.2, 0.2,
-0.2, -0.2,
0.2, 0.2,
0.2, 0.2,
-0.2, -0.2,
0.2, -0.2
]);
gl.drawArrays(gl.TRIANGLES, 0, 6)
|
拓展:这里需要注意点的顺序,因为点顺序的变化很有可能导致我们画出来的图形不是矩形
异步绘图
在有了缓冲区之后,我们的异步绘图逻辑其实就和我们之前的数组存点的逻辑是一样的,接下来我们用一个案例来看一下
1
2
3
4
5
6
7
8
9
10
11
12
13
14
15
16
17
18
19
20
21
22
23
24
25
26
27
28
29
30
31
32
33
34
35
36
37
38
39
40
41
42
43
44
45
46
47
48
49
50
51
52
53
54
55
56
57
58
59
60
61
62
63
64
65
66
67
68
69
70
71
72
73
74
75
76
77
78
79
80
81
82
83
84
85
86
87
88
89
| <!DOCTYPE html>
<html lang="en">
<head>
<meta charset="UTF-8" />
<title>异步绘图</title>
<style>
body {
margin: 0;
overflow: hidden;
}
#canvas {
background-color: antiquewhite;
}
</style>
</head>
<body>
<canvas id="canvas"></canvas>
<script id="vertexShader" type="x-shader/x-vertex">
attribute vec4 a_Position;
void main(){
gl_Position=a_Position;
gl_PointSize=20.0;
}
</script>
<script id="fragmentShader" type="x-shader/x-fragment">
void main(){
gl_FragColor=vec4(1,1,0,1);
}
</script>
<script type="module">
import { initShaders } from "../jsm/Utils.js";
const canvas = document.querySelector("#canvas");
canvas.width = window.innerWidth;
canvas.height = window.innerHeight;
const vsSource = document.querySelector("#vertexShader").innerText;
const fsSource = document.querySelector("#fragmentShader").innerText;
const gl = canvas.getContext("webgl");
initShaders(gl, vsSource, fsSource);
let vertices=[0, 0.2]
const vertexBuffer = gl.createBuffer();
gl.bindBuffer(gl.ARRAY_BUFFER, vertexBuffer);
gl.bufferData(gl.ARRAY_BUFFER,new Float32Array(vertices),gl.STATIC_DRAW)
const a_Position=gl.getAttribLocation(gl.program, 'a_Position')
gl.vertexAttribPointer(a_Position, 2, gl.FLOAT, false, 0, 0)
gl.enableVertexAttribArray(a_Position)
gl.clearColor(0, 0, 0, 1);
gl.clear(gl.COLOR_BUFFER_BIT);
gl.drawArrays(gl.POINTS, 0, 1);
setTimeout(()=>{
vertices.push(-0.2,-0.1)
gl.bufferData(gl.ARRAY_BUFFER,new Float32Array(vertices),gl.STATIC_DRAW)
gl.clear(gl.COLOR_BUFFER_BIT);
gl.drawArrays(gl.POINTS, 0, 2);
},1000)
setTimeout(()=>{
gl.clear(gl.COLOR_BUFFER_BIT);
gl.drawArrays(gl.POINTS, 0, 2);
gl.drawArrays(gl.LINE_STRIP, 0, 2);
},2000)
</script>
</body>
</html>
|
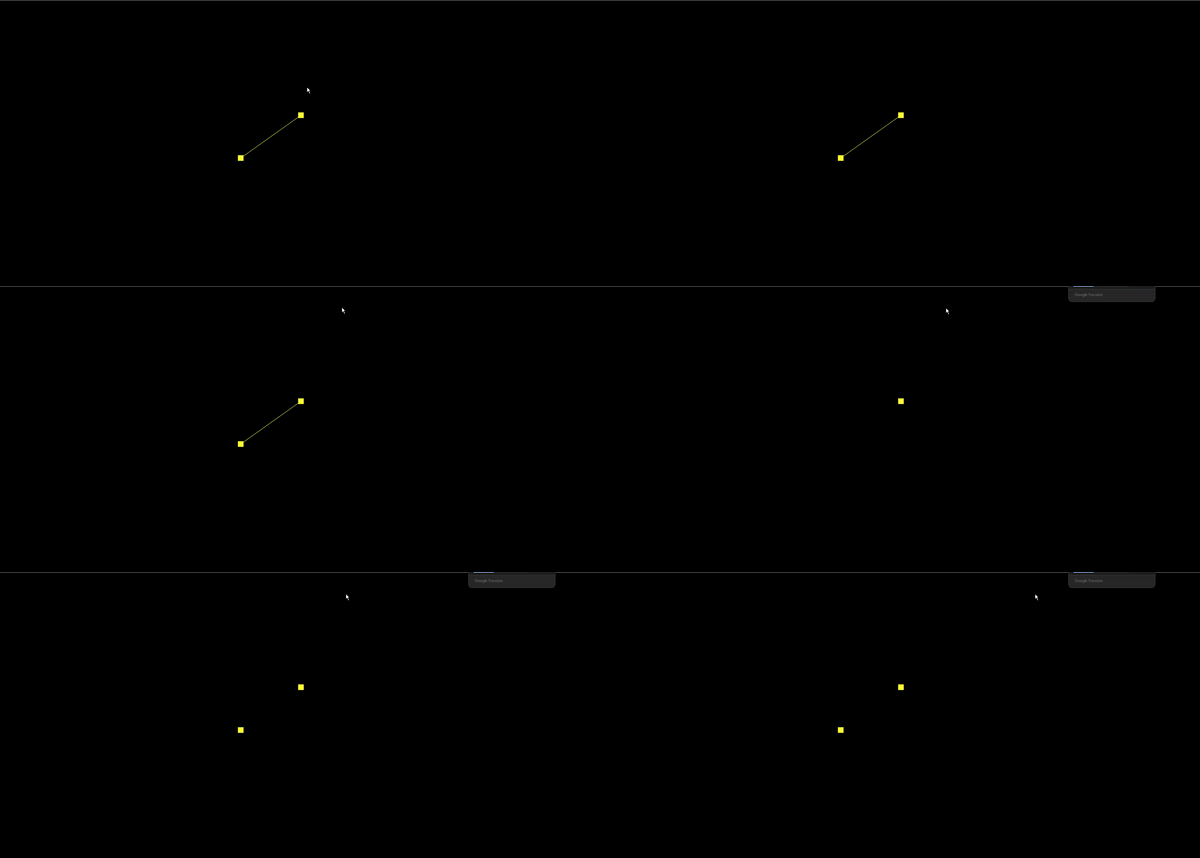
封装多边形对象
完整代码
1
2
3
4
5
6
7
8
9
10
11
12
13
14
15
16
17
18
19
20
21
22
23
24
25
26
27
28
29
30
31
32
33
34
35
36
37
38
39
40
41
42
43
44
45
46
47
48
49
50
51
52
53
54
55
56
57
58
59
60
61
62
63
64
65
66
67
68
69
70
71
72
73
74
75
76
77
78
79
80
81
82
83
84
85
86
| const defAttr=()=>({
gl:null,
vertices:[],
geoData:[],
size:2,
attrName:'a_Position',
count:0,
types:['POINTS'],
})
export default class Poly{
constructor(attr){
Object.assign(this,defAttr(),attr)
this.init()
}
init(){
const {attrName,size,gl}=this
if(!gl){return}
const vertexBuffer = gl.createBuffer()
gl.bindBuffer(gl.ARRAY_BUFFER, vertexBuffer)
this.updateBuffer()
const a_Position=gl.getAttribLocation(gl.program,attrName)
gl.vertexAttribPointer(a_Position, size, gl.FLOAT, false, 0, 0)
gl.enableVertexAttribArray(a_Position)
}
addVertice(...params){
this.vertices.push(...params)
this.updateBuffer()
}
popVertice(){
const {vertices,size}=this
const len=vertices.length
vertices.splice(len-size,len)
this.updateBuffer()
}
setVertice(ind,...params){
const {vertices,size}=this
const i=ind*size
params.forEach((param,paramInd)=>{
vertices[i+paramInd]=param
})
}
updateBuffer(){
const {gl,vertices}=this
this.updateCount()
gl.bufferData(gl.ARRAY_BUFFER,new Float32Array(vertices),gl.STATIC_DRAW)
}
updateCount(){
this.count=this.vertices.length/this.size
}
updateVertices(params){
const {geoData}=this
const vertices=[]
geoData.forEach(data=>{
params.forEach(key=>{
vertices.push(data[key])
})
})
this.vertices=vertices
}
draw(types=this.types){
const {gl,count}=this
for(let type of types){
gl.drawArrays(gl[type],0,count);
}
}
}
|
属性
- gl webgl上下文对象
- vertices 顶点数据集合,在被赋值的时候会做两件事
更新count 顶点数量,数据运算尽量不放渲染方法里
向缓冲区内写入顶点数据
- geoData 模型数据,对象数组,可解析出vertices 顶点数据
- size 顶点分量的数目
- positionName 代表顶点位置的attribute 变量名
- count 顶点数量
- types 绘图方式,可以用多种方式绘图
方法
- init() 初始化方法,建立缓冲对象,并将其绑定到webgl 上下文对象上,然后向其中写入顶点数据。将缓冲对象交给attribute变量,并开启attribute 变量的批处理功能。
- addVertice() 添加顶点
- popVertice() 删除最后一个顶点
- setVertice() 根据索引位置设置顶点
- updateBuffer() 更新缓冲区数据,同时更新顶点数量
- updateCount() 更新顶点数量
- updateVertices() 基于geoData 解析出vetices 数据
- draw() 绘图方法
然后我们利用刚才封装的多边形对象来完成上面的异步效果
1
2
3
4
5
6
7
8
9
10
11
12
13
14
15
16
| const poly=new Poly({
gl,
vertices:[0, 0.2]
})
poly.draw(['POINTS'])
setTimeout(()=>{
poly.addVertice(-0.2,-0.1)
gl.clear(gl.COLOR_BUFFER_BIT);
poly.draw(['POINTS'])
},1000)
setTimeout(()=>{
gl.clear(gl.COLOR_BUFFER_BIT);
poly.draw(['POINTS','LINE_STRIP'])
},2000)
|
绘制多线
我们需求是点击绘制点,然后将点连接起来,右击点击的时候,将重新以新的点击点为起点,后续的点将不再连接之前右击前的最后一个点。
建立容器对象
新建一个容器对象Sky,用来承载多个多边形对象
1
2
3
4
5
6
7
8
9
10
11
12
13
14
15
16
17
18
19
20
21
| export default class Sky{
constructor(gl){
this.gl=gl
this.children=[]
}
add(obj){
obj.gl=this.gl
this.children.push(obj)
}
updateVertices(params){
this.children.forEach(ele=>{
ele.updateVertices(params)
})
}
draw(){
this.children.forEach(ele=>{
ele.init()
ele.draw()
})
}
}
|
属性
- gl webgl上下文对象
- children 子级
方法
- add() 添加子对象
- updateVertices() 更新子对象的顶点数据
- draw() 遍历子对象绘图,每个子对象对应一个buffer 对象,所以在子对象绘图之前要先初始化。
示例代码
1
2
3
4
5
6
7
8
9
10
11
12
13
14
15
16
17
18
19
20
21
22
23
24
25
26
27
28
29
30
31
32
33
34
35
36
37
38
39
40
41
42
43
44
45
46
47
48
49
50
51
52
53
54
55
56
57
58
59
60
61
62
63
64
65
66
67
68
69
70
71
72
73
74
75
76
77
78
79
80
81
82
83
84
85
86
87
88
89
90
91
92
93
94
95
96
97
98
99
100
101
102
103
104
105
106
107
108
109
110
111
112
113
114
115
116
117
118
119
120
121
122
123
124
125
| <!DOCTYPE html>
<html lang="en">
<head>
<meta charset="UTF-8" />
<title>绘制多线</title>
<style>
body {
margin: 0;
overflow: hidden;
}
#canvas {
background-color: antiquewhite;
}
</style>
</head>
<body>
<canvas id="canvas"></canvas>
<script id="vertexShader" type="x-shader/x-vertex">
attribute vec4 a_Position;
void main(){
gl_Position=a_Position;
gl_PointSize=10.0;
}
</script>
<script id="fragmentShader" type="x-shader/x-fragment">
precision mediump float;
uniform bool u_IsPOINTS;
void main(){
if(u_IsPOINTS){
float dist=distance(gl_PointCoord,vec2(0.5,0.5));
if(dist<0.5){
gl_FragColor=vec4(1,1,0,1);
}else{
discard;
}
}else{
gl_FragColor=vec4(1,1,0,1);
}
}
</script>
<script type="module">
import { initShaders, getMousePosInWebgl } from "../jsm/Utils.js";
import Poly from "../jsm/Poly.js";
import Sky from "../jsm/Sky.js";
const canvas = document.querySelector("#canvas");
canvas.width = window.innerWidth;
canvas.height = window.innerHeight;
const vsSource = document.querySelector("#vertexShader").innerText;
const fsSource = document.querySelector("#fragmentShader").innerText;
const gl = canvas.getContext("webgl")
initShaders(gl, vsSource, fsSource);
gl.clearColor(0, 0, 0, 1);
gl.clear(gl.COLOR_BUFFER_BIT);
const sky = new Sky(gl)
let poly = null
canvas.oncontextmenu = function () {
return false;
}
canvas.addEventListener("mousedown", (event) => {
if (event.button === 2) {
popVertice()
} else {
const { x, y } = getMousePosInWebgl(event, canvas)
if (poly) {
poly.addVertice(x, y)
} else {
crtPoly(x, y)
}
}
render()
});
canvas.addEventListener("mousemove", (event) => {
if (poly) {
const { x, y } = getMousePosInWebgl(event, canvas)
poly.setVertice(poly.count - 1, x, y)
render()
}
});
function popVertice() {
poly.popVertice()
poly = null
}
function crtPoly(x, y) {
poly = new Poly({
vertices: [x, y, x, y],
types: ['POINTS', 'LINE_STRIP'],
circleDot: true
})
sky.add(poly)
}
function render() {
gl.clear(gl.COLOR_BUFFER_BIT)
sky.draw()
}
</script>
</body>
</html>
|
效果
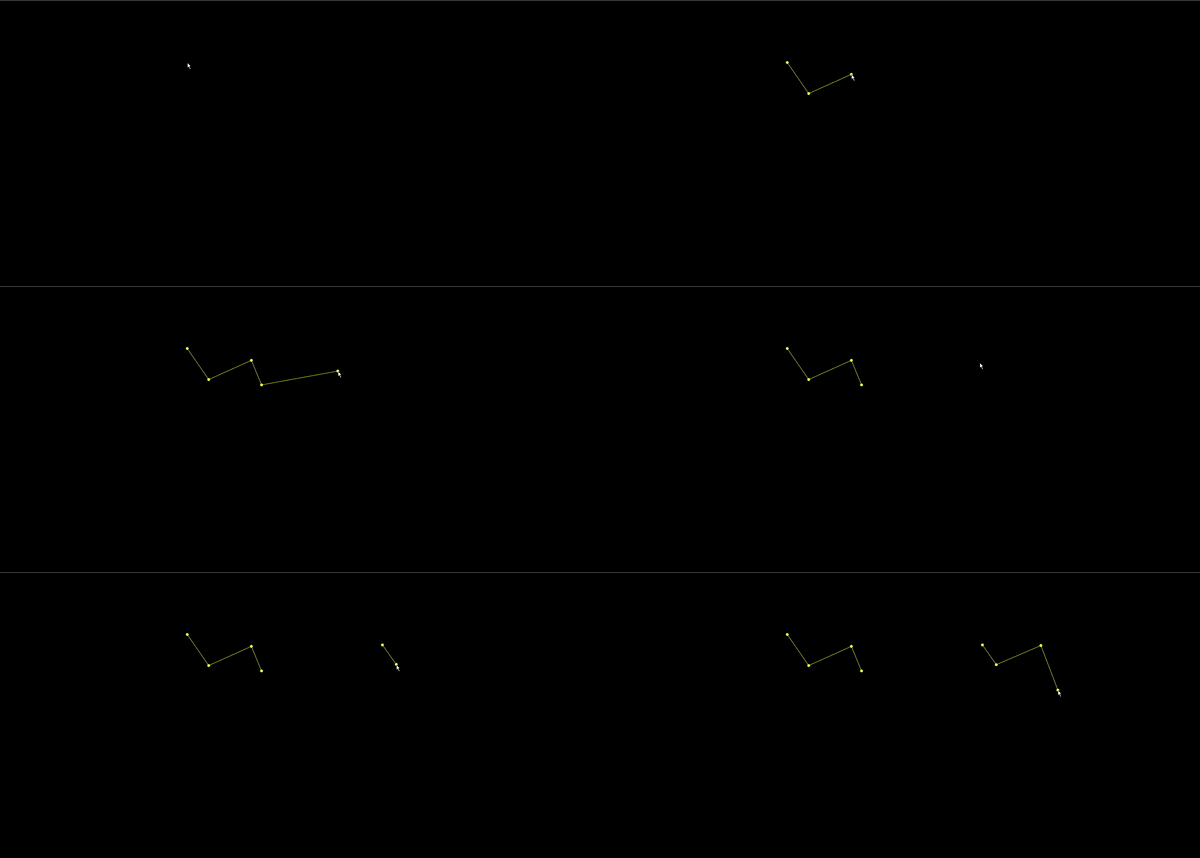
Demo-绘制狮子座
接下来,我们来实现一个小案例。
建立顶点着色器
1
2
3
4
5
6
7
8
9
| <script id="vertexShader" type="x-shader/x-vertex">
attribute vec4 a_Attr;
varying float v_Alpha;
void main(){
gl_Position=vec4(a_Attr.x,a_Attr.y,0.0,1.0);
gl_PointSize=a_Attr.z;
v_Alpha=a_Attr.w;
}
</script>
|
a_Attr() 是一个4维向量,其参数结构为(x,y,z,w)
- x,y代表位置
- z代表顶点尺寸
- w代表顶点透明度,w会通过 varying 变量v_Alpha 传递给片元
建立片元着色器
1
2
3
4
5
6
7
8
9
10
11
12
| <script id="fragmentShader" type="x-shader/x-fragment">
precision mediump float;
varying float v_Alpha;
void main(){
float dist=distance(gl_PointCoord,vec2(0.5,0.5));
if(dist<0.5){
gl_FragColor=vec4(0.87,0.91,1.0,v_Alpha);
}else{
discard;
}
}
</script>
|
通过v_Alpha接收透明度,然后设置片元的颜色。
建立夜空对象,用于承载多边形
建立合成对象,用于对顶点数据做补间运算
1
| const compose = new Compose();
|
声明两个变量,用于表示当前正在绘制的多边形和鼠标划上的点
1
2
3
4
|
let poly=null
let point=null
|
取消右击提示
1
2
3
4
|
canvas.oncontextmenu = function(){
return false;
}
|
鼠标按下事件
1
2
3
4
5
6
7
8
9
10
11
12
13
14
15
16
|
canvas.addEventListener("mousedown", (event) => {
if(event.button===2){
poly&&popVertice()
}else{
const {x,y}=getMousePosInWebgl(event,canvas)
if(poly){
addVertice(x,y)
}else{
crtPoly(x,y)
}
}
});
|
创建多边形
1
2
3
4
5
6
7
8
9
10
11
12
13
14
| function crtPoly(x,y){
let o1=point?point:{x,y,pointSize:random(),alpha:1}
const o2={x,y,pointSize:random(),alpha:1}
poly=new Poly({
size:4,
attrName:'a_Attr',
geoData:[o1,o2],
types:['POINTS','LINE_STRIP']
})
sky.add(poly)
crtTrack(o1)
crtTrack(o2)
}
|
建立两个顶点数据o1,o2,如果鼠标点击了其它顶点,o1的数据就是此顶点的数据。
顶点的尺寸是一个随机数random()
1
2
3
| function random(){
return Math.random()*8.0+3.0
}
|
基于两个顶点数据,建立多边形对象和两个时间轨对象。
建立时间轨
1
2
3
4
5
6
7
8
9
10
11
12
13
14
15
16
17
18
19
20
21
22
23
24
25
26
| function crtTrack(obj){
const {pointSize}=obj
const track = new Track(obj)
track.start = new Date()
track.timeLen = 2000
track.loop = true
track.keyMap = new Map([
[
"pointSize",
[
[500, pointSize],
[1000, 0],
[1500, pointSize],
],
],
[
"alpha",
[
[500, 1],
[1000, 0],
[1500, 1],
],
],
]);
compose.add(track)
}
|
addVertice() 添加顶点
1
2
3
4
5
6
7
8
9
| function addVertice(x,y){
const {geoData}=poly
if(point){
geoData[geoData.length-1]=point
}
let obj={x,y,pointSize:random(),alpha:1}
geoData.push(obj)
crtTrack(obj)
}
|
如果鼠标点击了其它顶点,就让多边形的最后一个顶点数据为此顶点。
建立下一个顶点的顶点数据,添加新的顶点,建立新的时间轨。
popVertice() 删除最后一个顶点
1
2
3
4
5
| function popVertice(){
poly.geoData.pop()
compose.children.pop()
poly=null
}
|
鼠标移动事件
1
2
3
4
5
6
7
8
9
10
11
12
13
14
| canvas.addEventListener("mousemove", (event) => {
const {x,y}=getMousePosInWebgl(event,canvas)
point=hoverPoint(x,y)
if(point){
canvas.style.cursor='pointer'
}else{
canvas.style.cursor='default'
}
if(poly){
const obj=poly.geoData[poly.geoData.length-1]
obj.x=x
obj.y=y
}
});
|
基于鼠标是否划上顶点,设置鼠标的视觉状态。
设置正在绘制的多边形的最后一个顶点点位。
hoverPoint() 检测所有顶点的鼠标划入,返回顶点数据
1
2
3
4
5
6
7
8
9
10
11
12
13
14
15
16
17
18
19
| function hoverPoint(mx,my){
for(let {geoData} of sky.children){
for(let obj of geoData){
if(poly&&obj===poly.geoData[poly.geoData.length-1]){
continue
}
const delta={
x:mx-obj.x,
y:my-obj.y
}
const {x,y}=glToCssPos(delta,canvas)
const dist=x*x+y*y;
if(dist<100){
return obj
}
}
}
return null
}
|
遍历sky 中的所有顶点数据
忽略绘图时随鼠标移动的点
获取鼠标和顶点的像素距离
若此距离小于10像素,返回此点;否则,返回null。
glToCssPos() webgl坐标系转css坐标系,将之前说过的getMousePosInWebgl() 方法逆向思维即可
1
2
3
4
5
6
7
| function glToCssPos({x,y},{width,height}){
const [halfWidth, halfHeight] = [width / 2, height / 2]
return {
x:x*halfWidth,
y:-y*halfHeight
}
}
|
连续渲染方法
1
2
3
4
5
6
| !(function ani() {
compose.update(new Date())
sky.updateVertices(['x','y','pointSize','alpha'])
render()
requestAnimationFrame(ani)
})();
|
更新动画数据
更新Vertices 数据
render() 渲染
1
2
3
4
| function render(){
gl.clear(gl.COLOR_BUFFER_BIT)
sky.draw()
}
|
完整代码
HTML
1
2
3
4
5
6
7
8
9
10
11
12
13
14
15
16
17
18
19
20
21
22
23
24
25
26
27
28
29
30
31
32
33
34
35
36
37
38
39
40
41
42
43
44
45
46
47
48
49
50
51
52
53
54
55
56
57
58
59
60
61
62
63
64
65
66
67
68
69
70
71
72
73
74
75
76
77
78
79
80
81
82
83
84
85
86
87
88
89
90
91
92
93
94
95
96
97
98
99
100
101
102
103
104
105
106
107
108
109
110
111
112
113
114
115
116
117
118
119
120
121
122
123
124
125
126
127
128
129
130
131
132
133
134
135
136
137
138
139
140
141
142
143
144
145
146
147
148
149
150
151
152
153
154
155
156
157
158
159
160
161
162
163
164
165
166
167
168
169
170
171
172
173
174
175
176
177
178
179
180
181
182
183
184
185
186
187
188
189
190
191
192
193
194
195
196
197
198
199
200
201
202
203
204
205
206
207
208
209
210
211
212
213
214
215
216
217
218
219
220
221
222
223
224
225
226
227
228
229
230
231
232
233
234
235
| <!DOCTYPE html>
<html lang="en">
<head>
<meta charset="UTF-8" />
<title>狮子座</title>
<style>
body {
margin: 0;
overflow: hidden;
}
#canvas {
background: url("./images/sky.jpg");
background-size: cover;
background-position: right bottom;
}
#audio {
position: absolute;
right: 20px;
bottom: 20px;
opacity: 10%;
transition: opacity 200ms;
z-index: 20;
}
#audio:hover {
opacity: 90%;
}
</style>
</head>
<body>
<canvas id="canvas"></canvas>
<audio id="audio" controls loop autoplay>
<source src="./audio/szz.mp3" type="audio/mpeg" />
</audio>
<script id="vertexShader" type="x-shader/x-vertex">
attribute vec4 a_Attr;
varying float v_Alpha;
void main(){
gl_Position=vec4(a_Attr.x,a_Attr.y,0.0,1.0);
gl_PointSize=a_Attr.z;
v_Alpha=a_Attr.w;
}
</script>
<script id="fragmentShader" type="x-shader/x-fragment">
precision mediump float;
uniform bool u_IsPOINTS;
varying float v_Alpha;
void main(){
if(u_IsPOINTS){
float dist=distance(gl_PointCoord,vec2(0.5,0.5));
if(dist<0.5){
gl_FragColor=vec4(0.87,0.91,1,v_Alpha);
}else{
discard;
}
}else{
gl_FragColor=vec4(0.87,0.91,1,v_Alpha);
}
}
</script>
<script type="module">
import { initShaders, getMousePosInWebgl, glToCssPos } from "../jsm/Utils.js";
import Poly from '../jsm/Poly.js';
import Sky from '../jsm/Sky.js';
import Compose from '../jsm/Compose.js';
import Track from '../jsm/Track.js';
const canvas = document.querySelector("#canvas");
canvas.width = window.innerWidth;
canvas.height = window.innerHeight;
const vsSource = document.querySelector("#vertexShader").innerText;
const fsSource = document.querySelector("#fragmentShader").innerText;
const gl = canvas.getContext("webgl");
gl.enable(gl.BLEND);
gl.blendFunc(gl.SRC_ALPHA, gl.ONE_MINUS_SRC_ALPHA);
initShaders(gl, vsSource, fsSource);
gl.clearColor(0, 0, 0, 0);
gl.clear(gl.COLOR_BUFFER_BIT);
const sky = new Sky(gl)
const compose = new Compose()
let poly = null
let point = null
canvas.oncontextmenu = function () {
return false
}
canvas.addEventListener('mousedown', (event) => {
if (event.button === 2) {
popVertice()
} else {
const { x, y } = getMousePosInWebgl(event, canvas)
if (poly) {
addVertice(x, y)
} else {
crtPoly(x, y)
}
}
render()
})
canvas.addEventListener('mousemove', (event) => {
const { x, y } = getMousePosInWebgl(event, canvas)
point = hoverPoint(x, y)
canvas.style.cursor = point ? 'pointer' : 'default'
if (poly) {
const obj = poly.geoData[poly.geoData.length - 1]
obj.x = x
obj.y = y
}
})
!(function ani() {
compose.update(new Date())
sky.updateVertices(['x', 'y', 'pointSize', 'alpha'])
render()
requestAnimationFrame(ani)
})()
function crtPoly(x, y) {
let o1 = point ? point : { x, y, pointSize: random(), alpha: 1 }
const o2 = { x, y, pointSize: random(), alpha: 1 }
poly = new Poly({
size: 4,
attrName: 'a_Attr',
geoData: [o1, o2],
types: ['POINTS', 'LINE_STRIP'],
circleDot: true
})
sky.add(poly)
crtTrack(o1)
crtTrack(o2)
}
function addVertice(x, y) {
const { geoData } = poly
if (point) {
geoData[geoData.length - 1] = point
}
let obj = { x, y, pointSize: random(), alpha: 1 }
geoData.push(obj)
crtTrack(obj)
}
function popVertice() {
poly.geoData.pop()
const { children } = compose
const last = children[children.length - 1]
children.delete(last)
poly = null
}
function crtTrack(obj) {
const { pointSize } = obj
const track = new Track(obj)
track.start = new Date()
track.timeLen = 2000
track.loop = true
track.keyMap = new Map([
[
"pointSize",
[
[500, pointSize],
[1000, 0],
[1500, pointSize],
],
],
[
"alpha",
[
[500, 1],
[1000, 0],
[1500, 1],
],
],
]);
compose.add(track)
}
function hoverPoint(mx, my) {
for (let { geoData } of sky.children) {
for (let obj of geoData) {
if (poly && obj === poly.geoData[poly.geoData.length - 1]) {
continue
}
const delta = {
x: mx - obj.x,
y: my - obj.y
}
const { x, y } = glToCssPos(delta, canvas)
const dist = x * x + y * y
if (dist < 100) {
return obj
}
}
}
return null
}
function random() {
return Math.random() * 8 + 3
}
function render() {
gl.clear(gl.COLOR_BUFFER_BIT);
sky.draw()
}
</script>
</body>
</html>
|
Util.js
1
2
3
4
5
6
7
8
9
10
11
12
13
14
15
16
17
18
19
20
21
22
23
24
25
26
27
28
29
30
31
32
33
34
35
36
37
38
39
40
41
42
43
44
45
46
47
48
49
50
51
52
53
54
55
56
57
58
59
60
61
62
63
64
65
66
67
68
69
70
71
72
73
74
75
76
77
| function initShaders(gl, vsSource, fsSource) {
const program = gl.createProgram();
const vertexShader = loadShader(gl, gl.VERTEX_SHADER, vsSource);
const fragmentShader = loadShader(gl, gl.FRAGMENT_SHADER, fsSource);
gl.attachShader(program, vertexShader);
gl.attachShader(program, fragmentShader);
gl.linkProgram(program);
gl.useProgram(program);
gl.program = program;
return true;
}
function createProgram(gl, vsSource, fsSource) {
const program = gl.createProgram();
const vertexShader = loadShader(gl, gl.VERTEX_SHADER, vsSource);
const fragmentShader = loadShader(gl, gl.FRAGMENT_SHADER, fsSource);
gl.attachShader(program, vertexShader);
gl.attachShader(program, fragmentShader);
gl.linkProgram(program);
return program
}
function loadShader(gl, type, source) {
const shader = gl.createShader(type);
gl.shaderSource(shader, source);
gl.compileShader(shader);
return shader;
}
function getMousePosInWebgl({ clientX, clientY }, canvas) {
const { left, top, width, height } = canvas.getBoundingClientRect();
const [cssX, cssY] = [clientX - left, clientY - top];
const [halfWidth, halfHeight] = [width / 2, height / 2];
const [xBaseCenter, yBaseCenter] = [
cssX - halfWidth,
cssY - halfHeight,
];
const yBaseCenterTop = -yBaseCenter;
return {
x: xBaseCenter / halfWidth,
y: yBaseCenterTop / halfHeight
}
}
function glToCssPos({ x, y }, { width, height }) {
const [halfWidth, halfHeight] = [width / 2, height / 2];
return {
x: x * halfWidth,
y: -y * halfHeight
}
}
export {
initShaders,
createProgram,
getMousePosInWebgl,
glToCssPos,
}
|
Track.js
1
2
3
4
5
6
7
8
9
10
11
12
13
14
15
16
17
18
19
20
21
22
23
24
25
26
27
28
29
30
31
32
33
34
35
36
37
38
39
40
41
42
43
44
45
46
47
48
49
| export default class Track {
constructor(target) {
this.target = target;
this.parent = null;
this.start = 0;
this.timeLen = 5;
this.loop = false;
this.keyMap = new Map();
this.onEnd = () => { }
this.prevTime=0
}
update(t) {
const { keyMap, timeLen, target, loop, start,prevTime } = this;
let time = t - start;
if (timeLen >= prevTime && timeLen < time) {
this.onEnd()
}
this.prevTime=time
if (loop) {
time = time % timeLen;
}
for (const [key, fms] of keyMap) {
const last = fms.length - 1;
if (time < fms[0][0]) {
target[key] = fms[0][1];
} else if (time > fms[last][0]) {
target[key] = fms[last][1];
} else {
target[key] = getValBetweenFms(time, fms, last);
}
}
}
}
function getValBetweenFms(time, fms, last) {
for (let i = 0; i < last; i++) {
const fm1 = fms[i];
const fm2 = fms[i + 1];
if (time >= fm1[0] && time <= fm2[0]) {
const delta = {
x: fm2[0] - fm1[0],
y: fm2[1] - fm1[1],
};
const k = delta.y / delta.x;
const b = fm1[1] - fm1[0] * k;
return k * time + b;
}
}
}
|
Sky.js
1
2
3
4
5
6
7
8
9
10
11
12
13
14
15
16
17
18
19
20
21
| export default class Sky{
constructor(gl){
this.gl=gl
this.children=[]
}
add(obj){
obj.gl=this.gl
this.children.push(obj)
}
updateVertices(params){
this.children.forEach(ele=>{
ele.updateVertices(params)
})
}
draw(){
this.children.forEach(ele=>{
ele.init()
ele.draw()
})
}
}
|
Poly.js
1
2
3
4
5
6
7
8
9
10
11
12
13
14
15
16
17
18
19
20
21
22
23
24
25
26
27
28
29
30
31
32
33
34
35
36
37
38
39
40
41
42
43
44
45
46
47
48
49
50
51
52
53
54
55
56
57
58
59
60
61
62
63
64
65
66
67
68
69
70
71
72
73
74
75
76
77
78
79
80
81
| const defAttr=()=>({
gl:null,
vertices:[],
geoData:[],
size:2,
attrName:'a_Position',
uniName:'u_IsPOINTS',
count:0,
types: ['POINTS'],
circleDot: false,
u_IsPOINTS:null
})
export default class Poly{
constructor(attr){
Object.assign(this,defAttr(),attr)
this.init()
}
init(){
const {attrName,size,gl,circleDot}=this
if(!gl){return}
const vertexBuffer = gl.createBuffer();
gl.bindBuffer(gl.ARRAY_BUFFER, vertexBuffer);
this.updateBuffer()
const a_Position=gl.getAttribLocation(gl.program, attrName)
gl.vertexAttribPointer(a_Position, size, gl.FLOAT, false, 0, 0)
gl.enableVertexAttribArray(a_Position)
if (circleDot) {
this.u_IsPOINTS=gl.getUniformLocation(gl.program, 'u_IsPOINTS')
}
}
updateBuffer(){
const {gl,vertices}=this
this.updateCount()
gl.bufferData(gl.ARRAY_BUFFER,new Float32Array(vertices),gl.STATIC_DRAW)
}
updateCount(){
this.count=this.vertices.length/this.size
}
addVertice(...params){
this.vertices.push(...params)
this.updateBuffer()
}
popVertice(){
const {vertices,size}=this
const len=vertices.length
vertices.splice(len-size,len)
this.updateCount()
}
setVertice(ind,...params){
const {vertices,size}=this
const i=ind*size
params.forEach((param,paramInd)=>{
vertices[i+paramInd]=param
})
}
updateVertices(params){
const {geoData}=this
const vertices=[]
geoData.forEach(data=>{
params.forEach(key=>{
vertices.push(data[key])
})
})
this.vertices=vertices
}
draw(types=this.types){
const {gl,count,circleDot,u_IsPOINTS}=this
for (let type of types) {
circleDot&&gl.uniform1f(u_IsPOINTS,type==='POINTS')
gl.drawArrays(gl[type],0,count);
}
}
}
|
Compose.js
1
2
3
4
5
6
7
8
9
10
11
12
13
14
15
16
17
18
19
20
21
22
23
24
25
| export default class Compose {
constructor() {
this.parent = null;
this.children = new Set();
}
add(obj) {
obj.parent = this;
this.children.add(obj);
}
update(t) {
this.children.forEach((ele) => {
ele.update(t);
});
}
deleteByTarget(targrt) {
const { children } = this
for (let child of children) {
if (child.target === targrt) {
children.delete(child)
break
}
}
}
}
|
效果图
我找不好点,点不出来老师的效果,就随便放张图给大家看一下
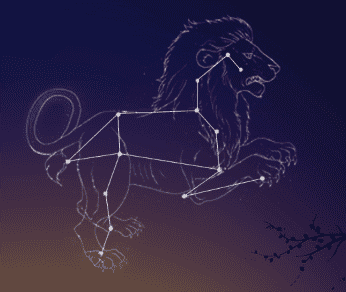
图形转面
图形拆分
就比如有这样一个图形,我们应该如何绘制呢
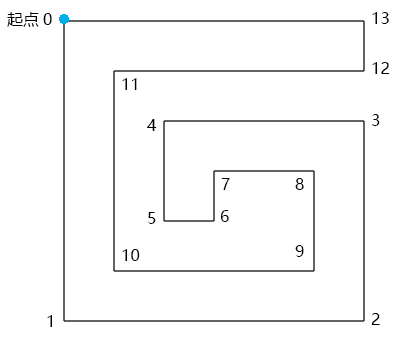
我们都知道,webgl只有绘制三角形的能力,那我们就应该将这个图形变成由多个三角形构成
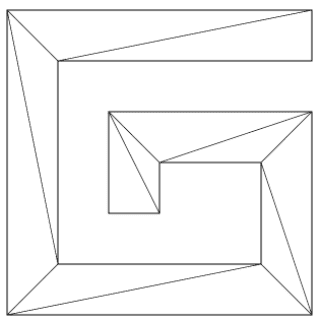
那我们该如何拆分呢?大概为以下步骤:(如果不理解可以去看老师视频,里面非常详细)
1.寻找满足以下条件的▲ABC:
▲ABC的顶点索引位置连续,如012,123、234
点C在向量AB的正开半平面里,可以理解为你站在A点,面朝B点,点C要在你的左手边
▲ABC中没有包含路径G 中的其它顶点
2.当找到▲ABC 后,就将点B从路径的顶点集合中删掉,然后继续往后找。
3.当路径的定点集合只剩下3个点时,就结束。
4.由所有满足条件的▲ABC构成的集合就是我们要求的独立三角形集合。
绘制路径G
接下来,我们绘制以下路径G。
路径G的顶点数据
1
2
3
4
5
6
7
8
9
10
11
12
13
14
15
16
| const pathData = [
0, 0,
0, 600,
600, 600,
600, 200,
200, 200,
200, 400,
300, 400,
300, 300,
500, 300,
500, 500,
100, 500,
100, 100,
600, 100,
600, 0
];
|
在pathData里两个数字为一组,分别代表顶点的x位和y位。
pathData里的数据是我以像素为单位画出来的,在实际项目协作中,UI给我们的svg文件可能也是以像素为单位画出来的,这个我们要做好心理准备。
因为,webgl画布的宽和高永远都是两个单位。
所以,我们要将上面的点画到webgl 画布中,就需要做一个数据映射。
在webgl 中绘制正方形
从pathData 数据中我们可以看出,路径G的宽高都是600,是一个正方形。
所以,我可以将路径G映射到webgl 画布的一个正方形中。
这个正方形的高度我可以暂且定为1,那么其宽度就应该是高度除以canvas画布的宽高比。
1
2
3
4
5
6
|
const ratio = canvas.width / canvas.height;
const rectH = 1.0;
const rectW = rectH / ratio;
|
正方形的定位,把正方形放在webgl画布的中心
获取正方形尺寸的一半,然后求出其x、y方向的两个极值即可。
1
2
3
4
5
6
7
|
const [halfRectW, halfRectH] = [rectW / 2, rectH / 2];
const minX = -halfRectW;
const minY = -halfRectH;
const maxX = halfRectW;
const maxY = halfRectH;
|
利用之前的Poly对象绘制正方形,测试一下效果。
1
2
3
4
5
6
7
8
9
10
| const rect = new Poly({
gl,
vertices: [
minX, maxY,
minX, minY,
maxX, minY,
maxX, maxY,
],
});
rect.draw();
|
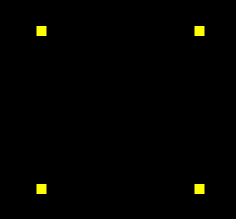
建立x轴和y轴比例尺
1
2
3
4
5
6
7
8
9
10
11
12
13
| const scaleX = ScaleLinear(0, minX, 600, maxX);
const scaleY = ScaleLinear(0, minY, 600, maxY);
function ScaleLinear(ax, ay, bx, by) {
const delta = {
x: bx - ax,
y: by - ay,
};
const k = delta.y / delta.x;
const b = ay - ax * k;
return function (x) {
return k * x + b;
};
}
|
ScaleLinear(ax, ay, bx, by) 方法使用的就是点斜式,用于将x轴和y轴上的数据像素数据映射成 webgl数据
ax 像素数据的极小值
ay webgl数据的极小值
bx 像素数据的极大值
by webgl数据的极大值
将路径G中的像素数据解析为webgl 数据
1
2
3
4
| const glData = [];
for (let i = 0; i < pathData.length; i += 2) {
glData.push(scaleX(pathData[i]), scaleY(pathData[i + 1]));
}
|
绘制查看效果
1
2
3
4
5
6
| const path = new Poly({
gl,
vertices: glData,
types: ["POINTS", "LINE_LOOP"],
});
path.draw();
|
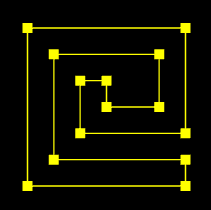
图形网格化
1
2
3
4
5
6
7
| const shapeGeo = new ShapeGeo(glData);
const face = new Poly({
gl,
vertices: shapeGeo.vertices,
types: ["TRIANGLES"],
});
face.draw();
|
1
2
3
4
5
6
7
8
9
10
11
12
13
14
15
16
17
18
19
20
21
22
23
24
25
26
27
28
29
30
31
32
33
34
35
36
37
38
39
40
41
42
43
44
45
46
47
48
49
50
51
52
53
54
55
56
57
58
59
60
61
62
63
64
65
66
67
68
69
70
71
72
73
74
75
76
77
78
79
80
81
82
83
84
85
86
| export default class ShapeGeo {
constructor(pathData=[]) {
this.pathData = pathData;
this.geoData = [];
this.triangles = [];
this.vertices = [];
this.parsePath();
this.update();
}
update() {
this.vertices = [];
this.triangles = [];
this.findTriangle(0);
this.upadateVertices()
}
parsePath() {
this.geoData = [];
const { pathData, geoData } = this
for (let i = 0; i < pathData.length; i += 2) {
geoData.push({ x: pathData[i], y: pathData[i + 1] })
}
}
findTriangle(i) {
const { geoData, triangles } = this;
const len = geoData.length;
if (geoData.length <= 3) {
triangles.push([...geoData]);
} else {
const [i0, i1, i2] = [
i % len,
(i + 1) % len,
(i + 2) % len
];
const triangle = [
geoData[i0],
geoData[i1],
geoData[i2],
];
if (this.cross(triangle) > 0 && !this.includePoint(triangle)) {
triangles.push(triangle);
geoData.splice(i1, 1);
}
this.findTriangle(i1);
}
}
includePoint(triangle) {
for (let ele of this.geoData) {
if (!triangle.includes(ele)) {
if (this.inTriangle(ele, triangle)) {
return true;
}
}
}
return false;
}
inTriangle(p0, triangle) {
let inPoly = true;
for (let i = 0; i < 3; i++) {
const j = (i + 1) % 3;
const [p1, p2] = [triangle[i], triangle[j]];
if (this.cross([p0, p1, p2]) < 0) {
inPoly = false;
break
}
}
return inPoly;
}
cross([p0, p1, p2]) {
const [ax, ay, bx, by] = [
p1.x - p0.x,
p1.y - p0.y,
p2.x - p0.x,
p2.y - p0.y,
];
return ax * by - bx * ay;
}
upadateVertices() {
const arr = []
this.triangles.forEach(triangle => {
for (let { x, y } of triangle) {
arr.push(x, y)
}
})
this.vertices = arr
}
}
|
属性
- pathData 平展开的路径数据
- geoData 由路径数据pathData 转成的对象型数组
- triangles 三角形集合,对象型数组
- vertices 平展开的对立三角形顶点集合
方法
- update() 更新方法,基于pathData 生成vertices
- parsePath() 基于路径数据pathData 转成对象型数组
- findTriangle(i) 寻找符合条件的三角形
- i 顶点在geoData 中的索引位置,表示从哪里开始寻找三角形
- includePoint(triangle) 判断三角形中是否有其它顶点
- inTriangle(p0, triangle) 判断一个顶点是否在三角形中
- cross([p0, p1, p2]) 以p0为基点,对二维向量p0p1、p0p2做叉乘运算
- upadateVertices() 基于对象数组geoData 生成平展开的vertices 数据

结语
本篇文章就到这里结束了,如果有不理解的可以去看一下老师的视频,里面还是比较详细的,毕竟文字内容没法像视频那样具象化,债见~


