前言
本文简单讲解一个小案例,利用向量知识生成一颗树,能够更好的帮助大家理解向量
创建 canvas 的 dom
写一个 canvas 的 dom 对象
1
| <canvas width="512" height="512"></canvas>
|
创建 canvas2d 对象
这里我们先创建一个 canvas2 对象
1
2
| const canvas = document.querySelector("canvas");
const ctx = canvas.getContext("2d");
|
移动坐标系
我们都知道 canvas 是坐标原点在左上角,x 轴向右,y 轴向下,这样很不方便我们计算,我们移动坐标系,把坐标原点移动到左下角,y 轴向上,x 轴向右,这样比较符合我们平时的理解
1
2
| ctx.translate(0, canvas.height);
ctx.scale(1, -1);
|
改变线段末端的形状
我们为了美观,设置一下画线的末端是圆
这里稍微拓展一下,这里还有其他的几个属性:
- butt
线条末端呈正方形。这是默认值。
- square
线条末端呈方形,通过添加一个宽度与线条粗细相同且高度粗细的一半的盒子来形成。
定义画线的函数
1
2
3
| function drawBranch(context, v0, length, thickness, dir, bias){
....xxxx
}
|
参数详解
这里有 6 个参数
- context 是我们的 Canvas2D 上下文
- v0 是起始向量
- length 是当前树枝的长度
- thickness 是当前树枝的粗细
- dir 是当前树枝的方向,用与 x 轴的夹角表示,单位是弧度
- bias 是一个随机偏向因子,用来让树枝的朝向有一定的随机性
向量旋转
这个之前在讲解 webgl 的时候起始解释过了,这里重新说一下。
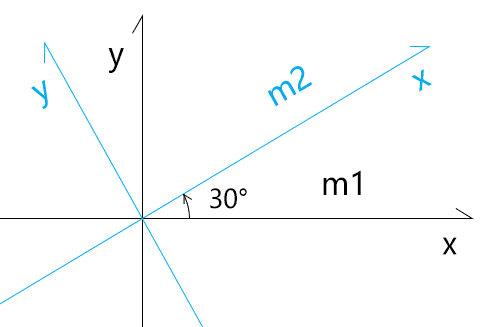
如图所示

我们假设旋转了 30 度,然后有俩个单位向量(1,0),(0,1),旋转之后对应的坐标分别为(cos 30,sin 30),(cos 30,-sin 30),可以得到旋转矩阵为
1
2
3
4
| [
cos rad, -sin rad,
cos rad, sin rad
]
|
因此,我们利用了矩阵和向量相乘的方式可以得到坐标系内任意一点旋转之后得到的位置为
1
2
3
4
5
6
7
8
9
10
| rotate(rad) {
const c = Math.cos(rad),
s = Math.sin(rad);
const [x, y] = this;
this.x = x * c + y * -s;
this.y = x * s + y * c;
return this;
}
|
可能我讲解的也不是很能让你理解,这里还有个我觉得不错的解答,你也可以去了解一下
https://zhuanlan.zhihu.com/p/98007510
计算下一个点的位置
因为 v0 是树枝的起点坐标,那根据前面向量计算的原理,我们创建一个单位向量 (1, 0),它是一个朝向 x 轴,长度为 1 的向量。然后我们旋转 dir 弧度,再乘以树枝长度 length。这样,我们就能计算出树枝的终点坐标了。代码如下:
1
2
| const v = new Vector2D(1, 0).rotate(dir).scale(length);
const v1 = v0.copy().add(v);
|
画出分支
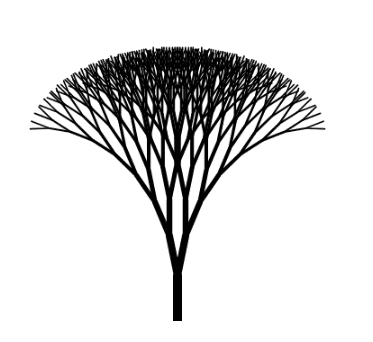
我们可以从一个起始角度开始递归地旋转树枝,每次将树枝分叉成左右两个分枝:
1
2
3
4
5
6
7
8
9
10
11
12
13
14
15
16
17
18
19
20
| function drawBranch(context, v0, length, thickness, dir, bias) {
const v = new Vector2D().rotate(dir).scale(length);
const v1 = v0.copy().add(v);
context.lineWidth = thickness;
context.beginPath();
context.moveTo(...v0);
context.lineTo(...v1);
context.stroke();
if (thickness > 2) {
const left = dir + 0.2;
drawBranch(context, v1, length * 0.9, thickness * 0.8, left, bias * 0.9);
const right = dir - 0.2;
drawBranch(context, v1, length * 0.9, thickness * 0.8, right, bias * 0.9);
}
}
const v0 = new Vector2D(256, 0);
drawBranch(ctx, v0, 50, 10, Math.PI / 2, 3);
|

加入随机因子
1
2
3
4
5
6
| if (thickness > 2) {
const left = Math.PI / 4 + 0.5 * (dir + 0.2) + bias * (Math.random() - 0.5);
drawBranch(context, v1, length * 0.9, thickness * 0.8, left, bias * 0.9);
const right = Math.PI / 4 + 0.5 * (dir - 0.2) + bias * (Math.random() - 0.5);
drawBranch(context, v1, length * 0.9, thickness * 0.8, right, bias * 0.9);
}
|

绘制花
为了好看一点,我再随机生成一些短的红线
1
2
3
4
5
6
7
8
9
10
11
| if (thickness < 5 && Math.random() < 0.3) {
context.save();
context.strokeStyle = "#c72c35";
const th = Math.random() * 6 + 3;
context.lineWidth = th;
context.beginPath();
context.moveTo(...v1);
context.lineTo(v1.x, v1.y - 2);
context.stroke();
context.restore();
}
|
这里用了context.save和context.restore用来处理画笔起始点变化的情况,因为我将画笔移动到了下一个点上面,然后在这个点的y轴向下-2,移动比较少,因为线段末端是圆,所以画出来的线段有点像椭圆形
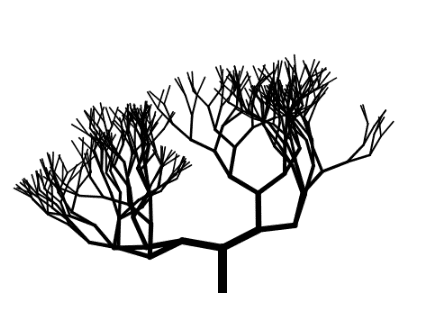
最终效果就是这样了

完整代码
1
2
3
4
5
6
7
8
9
10
11
12
13
14
15
16
17
18
19
20
21
22
23
24
25
26
27
28
29
30
31
32
33
34
35
36
37
38
39
40
41
42
| import {Vector2D} from '../common/lib/vector2d.js';
const canvas = document.querySelector('canvas');
const ctx = canvas.getContext('2d');
ctx.translate(0, canvas.height);
ctx.scale(1, -1);
ctx.lineCap = 'round';
function drawBranch(context, v0, length, thickness, dir, bias) {
const v = new Vector2D().rotate(dir).scale(length);
const v1 = v0.copy().add(v);
context.lineWidth = thickness;
context.beginPath();
context.moveTo(...v0);
context.lineTo(...v1);
context.stroke();
if(thickness > 2) {
const left = Math.PI / 4 + 0.5 * (dir + 0.2) + bias * (Math.random() - 0.5);
drawBranch(context, v1, length * 0.9, thickness * 0.8, left, bias * 0.9);
const right = Math.PI / 4 + 0.5 * (dir - 0.2) + bias * (Math.random() - 0.5);
drawBranch(context, v1, length * 0.9, thickness * 0.8, right, bias * 0.9);
}
if(thickness < 5 && Math.random() < 0.3) {
context.save();
context.strokeStyle = '#c72c35';
const th = Math.random() * 6 + 3;
context.lineWidth = th;
context.beginPath();
context.moveTo(...v1);
context.lineTo(v1.x, v1.y - 2);
context.stroke();
context.restore();
}
}
const v0 = new Vector2D(256, 0);
drawBranch(ctx, v0, 50, 10, 1, 3);
|
1
2
3
4
5
6
7
8
9
10
11
12
13
14
15
16
17
18
19
20
21
22
23
24
25
26
27
28
29
30
31
32
33
34
35
36
37
38
39
40
41
42
43
44
45
46
47
48
49
50
51
52
53
54
55
56
57
58
59
60
61
62
63
64
65
66
67
68
69
70
71
72
73
74
| export class Vector2D extends Array {
constructor(x = 1, y = 0) {
super(x, y);
}
set x(v) {
this[0] = v;
}
set y(v) {
this[1] = v;
}
get x() {
return this[0];
}
get y() {
return this[1];
}
get length() {
return Math.hypot(this.x, this.y);
}
get dir() {
return Math.atan2(this.y, this.x);
}
copy() {
return new Vector2D(this.x, this.y);
}
add(v) {
this.x += v.x;
this.y += v.y;
return this;
}
sub(v) {
this.x -= v.x;
this.y -= v.y;
return this;
}
scale(a) {
this.x *= a;
this.y *= a;
return this;
}
cross(v) {
return this.x * v.y - v.x * this.y;
}
dot(v) {
return this.x * v.x + v.y * this.y;
}
normalize() {
return this.scale(1 / this.length);
}
rotate(rad) {
    const c = Math.cos(rad),
      s = Math.sin(rad);
    const [x, y] = this;

    this.x = x * c + y * -s;
    this.y = x * s + y * c;

    return this;
  }
}
|
结语
本篇文章就到这里了,更多内容敬请期待,债见~


