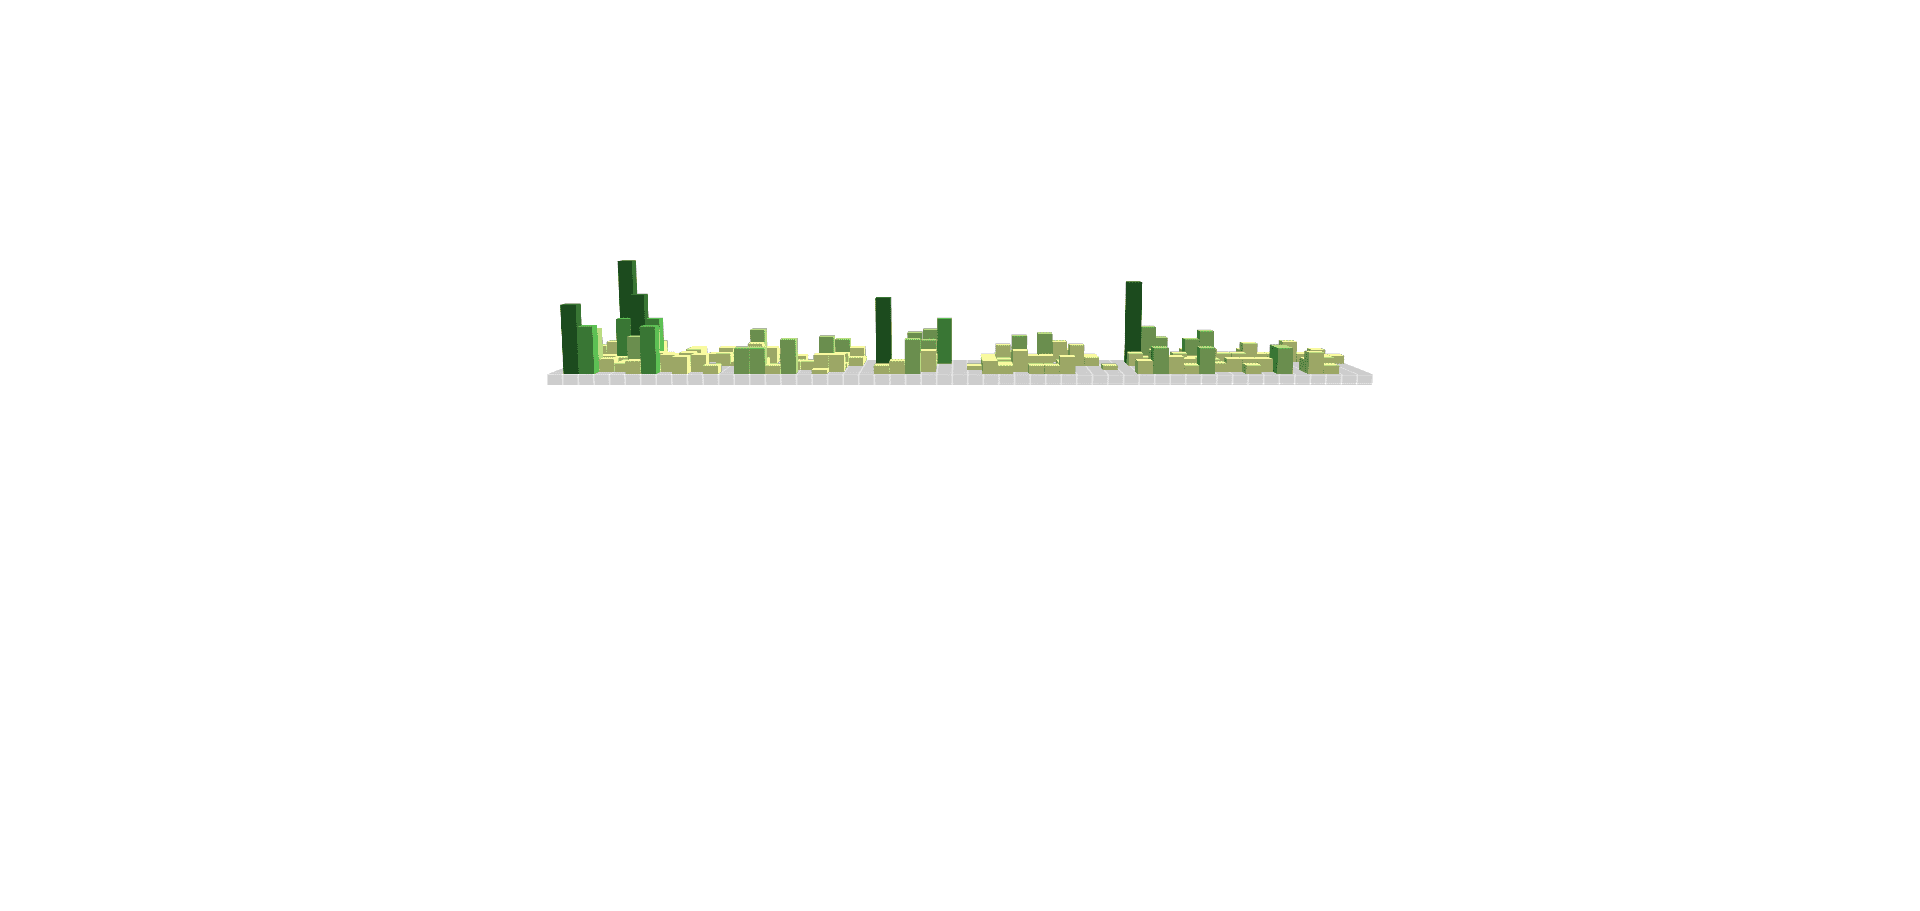
前言 有看到人家做Github的贡献表,想着自己也做一个,就有了这篇文章。
获取数据 这里我使用 python 爬数据了,当然你们可以使用其他的,我也懒得去破解 gitee 的反爬,所以我就使用selenium直接获取数据了,如果看不懂我这里的爬取方法,建议去看看我之前讲解 python 爬虫的文章。
导入库 这里我需要 selenium 和 bs4 以及 time 这三个库(他们需要安装的,要用的话去看我之前的爬虫文章)
1
2
3
4
5
6
import timefrom selenium import webdriver from selenium.webdriver.common.by import Byfrom bs4 import BeautifulSoup
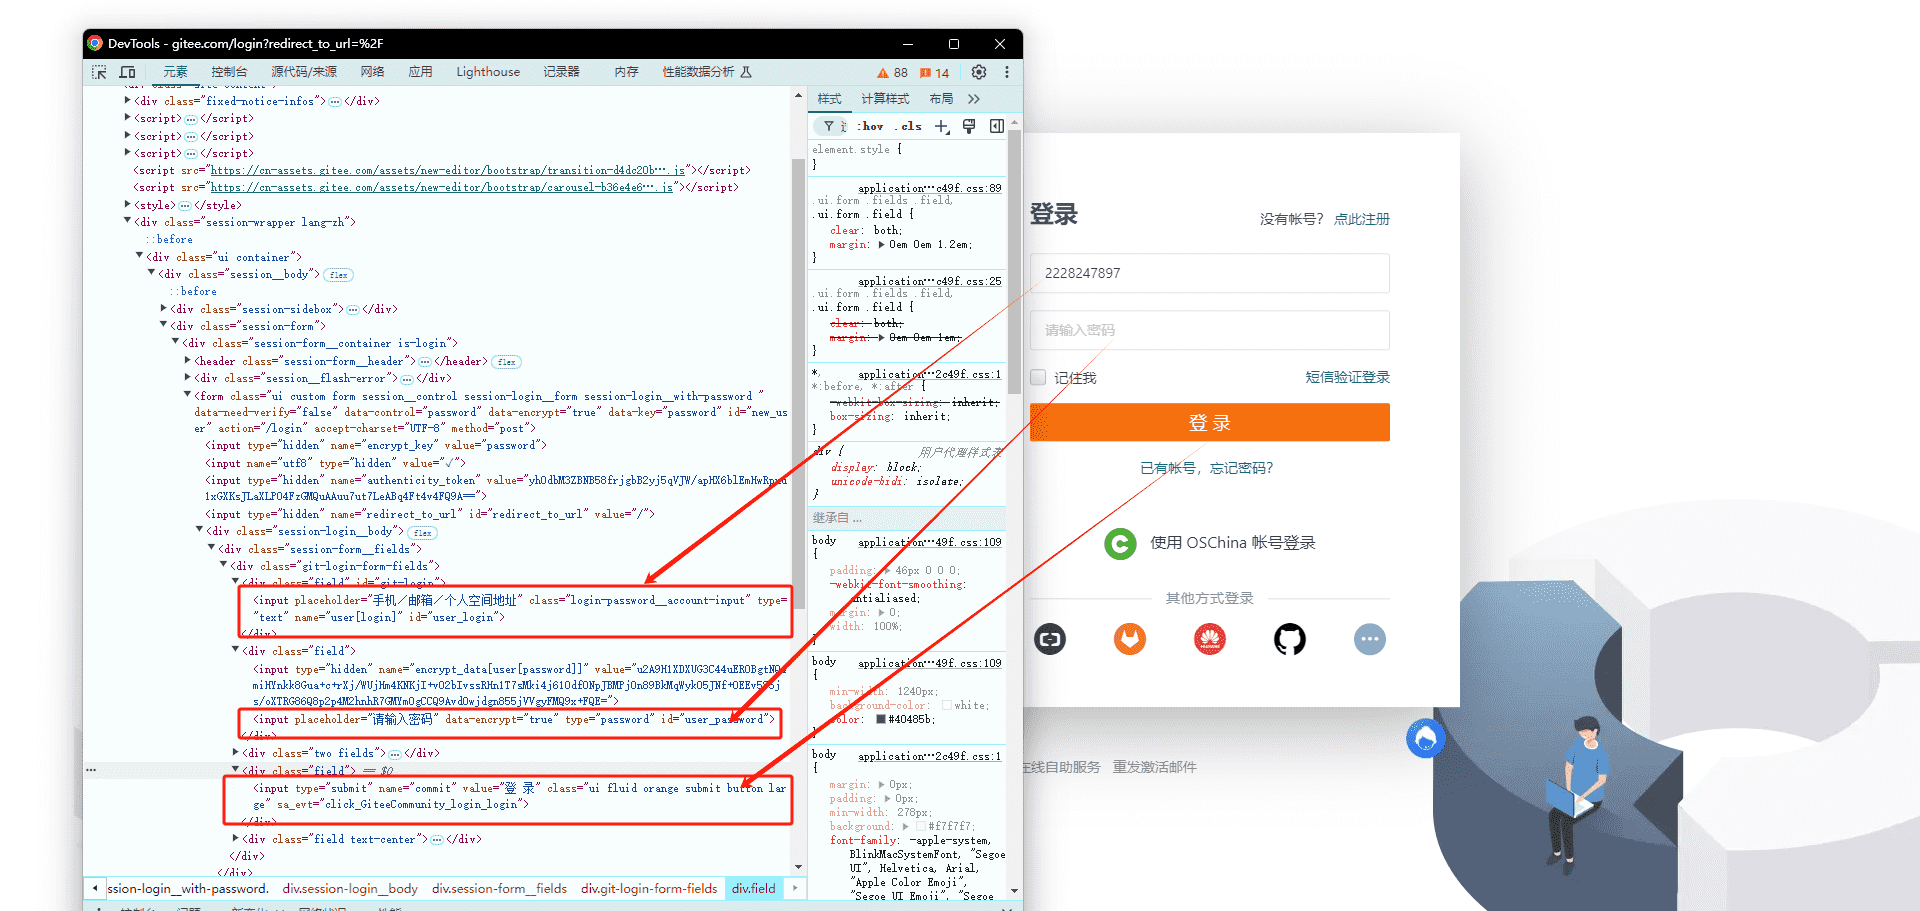
登录 首先我们要安装谷歌驱动,这个在之前的 python 文章也说过了,然后获取账号密码的 dom,清空内容输入你的账号密码,然后点击登录
1
2
3
4
5
6
7
8
9
10
11
12
13
14
15
16
17
18
driver = webdriver.Chrome() driver.get('https://gitee.com/login?redirect_to_url=%2F' ) inputAccountDom=driver.find_element(by=By.ID, value="user_login" ) inputAccountDom.clear() inputAccountDom.send_keys('你的账号' ) inputPasswordDom = driver.find_element(by=By.ID, value='user_password' ) inputPasswordDom.clear() inputPasswordDom.send_keys('你的密码' ) buttonDom = driver.find_element(by=By.NAME, value='commit' ) buttonDom.click()
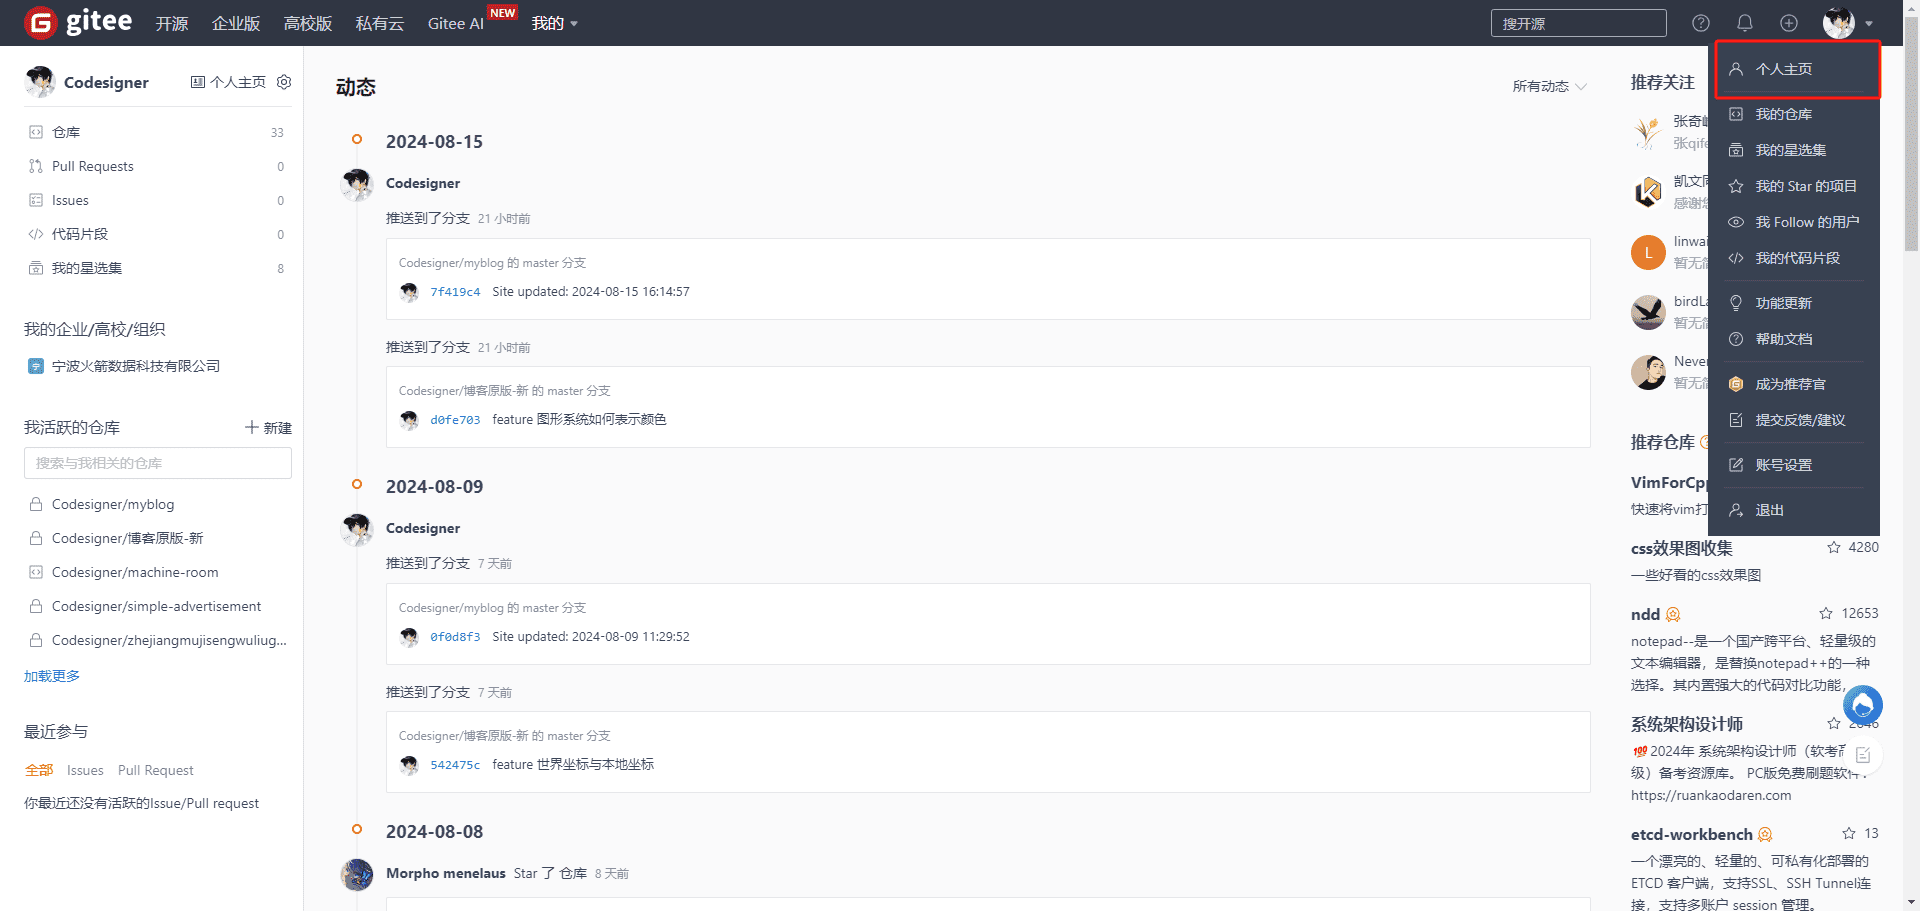
前往个人主页 此时经过上面的代码,我们已经登录成功了,这时候要前往个人主页
1 2 3 4 5 6 7 8 9 10 11 12 13 time.sleep(3 ) avatarBtn = driver.find_element(by=By.CLASS_NAME, value='ant-avatar-circle' ) avatarBtn.click() time.sleep(2 ) homeBtn = driver.find_element(by=By.CLASS_NAME, value='gitee-header__user__item' ) homeBtn.click() time.sleep(2 )
加载个人主页 dom 这个时候我们已经在个人主页的页面上了,加载完成所有的 dom 内容
1 2 pageSource = driver.page_source
解析 dom 然后有了 dom 结构之后,我们用 bs4 去解析
1 bs = BeautifulSoup(pageSource, 'html.parser' )
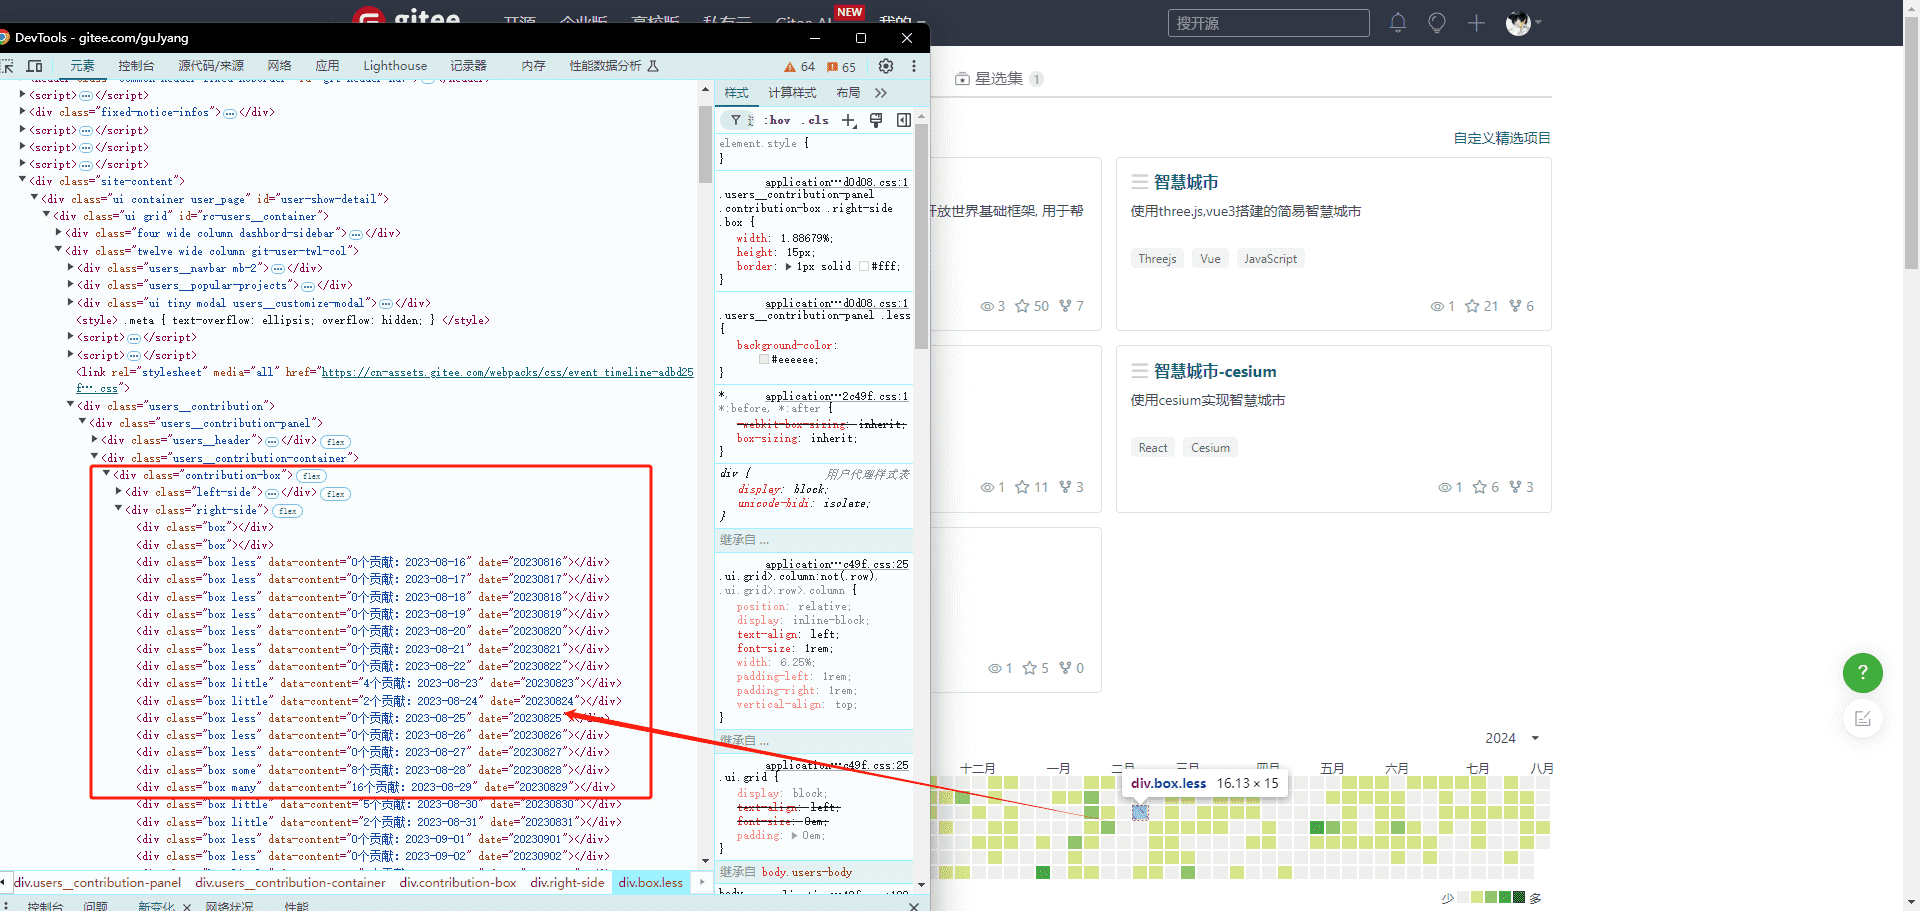
得到贡献 dom 然后我们根据 dom 结构得到贡献的 dom 内容
1 boxs = bs.find('div' , class_='contribution-box' ).find('div' , class_='right-side' ).find_all('div' , class_='box' )
写入内容到 txt 中 接下来我们将贡献的内容写入一个 txt 中
1
2
3
4
5
6
7
8
9
10
str_all = '' for i in range (len (boxs)): print (boxs[i]) text = boxs[i].get('data-content' ) if (text): str_all += text str_all += '\n' k = open ('gitee-contribution.txt' , 'a+' ) k.write(str_all) k.close()
关闭浏览器 最终效果 Your browser does not support the video tag.
实现 3D 柱状图 这里我们使用SpriteJS,SpriteJS 是基于 WebGL 的图形库,它是一个支持树状元素结构的渲染库。也就是说,它和我们前端操作 DOM 类似,通过将元素一一添加到渲染树上,就可以完成最终的渲染。
创建 Scene 对象 像 DOM 有 documentElement 作为根元素一样,SpriteJS 也有根元素。SpriteJS 的根元素是一个 Scene 对象,对应一个 DOM 元素作为容器。更形象点来说,我们可以把 Scene 理解为一个“场景”。那 SpriteJS 中渲染图形,都要在这个“场景”中进行。接下来,我们就创建一个 Scene 对象,代码如下:
1
2
3
4
5
6
const container = document .getElementById ("stage" );const scene = new Scene ({ container, displayRatio : 2 , });
建 Scene 对象,我们需要两个参数。一个参数是 container,它是一个 HTML 元素,在这里是一个 id 为 stage 的元素,这个元素会作为 SpriteJS 的容器元素,之后 SpriteJS 会在这个元素上创建 Canvas 子元素。第二个参数是 displayRatio,这个参数是用来设置显示分辨率的。这里,我们把 displayRatio 设为 2,就可以让像素宽高是 CSS 样式宽高的 2 倍,对于一些像素密度为 2 的设备(如 iPhone 的屏幕),这么设置才不会让画布上绘制的图片、文字变得模糊。
创建 Layer 对象 有了 scene 对象,我们再创建一个或多个 Layer 对象,也可以理解为是一个或者多个“图层”。在 SpriteJS 中,一个 Layer 对象就对应于一个 Canvas 画布。
1
2
3
4
5
6
7
const layer = scene.layer3d ("fglayer" , { camera : { fov : 35 , }, }); layer.camera .attributes .pos = [2 , 6 , 9 ]; layer.camera .lookAt ([0 , 0 , 0 ]);
如上面代码所示,我们通过调用 scene.layer3d 方法,就可以在 scene 对象上创建了一个 3D(WebGL)上下文的 Canvas 画布。而且这里,我们把相机的视角设置为 35 度,坐标位置为(2, 6, 9),相机朝向坐标原点。
将数据转换成柱状元素 接着,我们就要把数据转换成画布上的长方体元素。我们可以借助d3-selection ,d3 是一个数据驱动文档的模型,d3-selection 能够通过数据操作文档树,添加元素节点。当然,在使用 d3-selection 添加元素前,我们要先创建用来 3D 展示的 WebGL 程序。
1
2
3
4
const program = layer.createProgram ({ vertex : shaders.GEOMETRY .vertex , fragment : shaders.GEOMETRY .fragment , });
创建好 WebGL 程序之后,我们就可以获取数据,用数据来操作文档树了。这里的 getData 方法就是我整理数据的方法,下面再说
1
2
3
4
5
6
7
8
9
10
11
12
13
14
15
16
17
18
19
20
21
22
23
24
25
26
27
28
29
30
const dataset = await getData ();const max = d3.max (dataset, (a ) => { return a.count ; }); const selection = d3.select (layer);const chart = selection .selectAll ("cube" ) .data (dataset) .enter () .append (() => { return new Cube (program); }) .attr ("width" , 0.14 ) .attr ("depth" , 0.14 ) .attr ("height" , 1 ) .attr ("scaleY" , (d ) => { return d.count / max; }) .attr ("pos" , (d, i ) => { const x0 = -3.8 + 0.0717 + 0.0015 ; const z0 = -0.5 + 0.05 + 0.0015 ; const x = x0 + 0.143 * Math .floor (i / 7 ); const z = z0 + 0.143 * (i % 7 ); return [x, (0.5 * d.count ) / max, z]; }) .attr ("colors" , (d, i ) => { return d.color ; });
如上面代码所示,我们先通过 d3.select(layer) 对象获得一个 selection 对象,再通过 getData() 获得数据,接着通过 selection.selectAll(‘cube’).data(dataset).enter().append(…) 遍历数据,创建元素节点。
数据整理 我将数据 txt 导入,进行了整理,给不同的贡献度加上了我自己的颜色
1 2 3 4 5 6 7 8 9 10 11 12 13 14 15 16 17 18 19 20 21 22 23 24 25 26 27 28 29 30 31 32 33 34 35 36 37 38 39 40 41 42 43 44 45 46 47 48 49 50 51 52 53 54 55 56 57 58 59 60 61 62 63 function importTxtFile (filePath, name, charsetType = "GBK" ) { return new Promise ((resolve, reject ) => { const xhr = new XMLHttpRequest (); xhr.open ( "GET" , `${filePath} ` , false ); xhr.overrideMimeType (`text/plain; charset=${charsetType} ` ); xhr.send (); if (xhr.readyState === 4 && xhr.status === 200 ) { const content = xhr.responseText ; const lines = content.split ("\n" ); const jsonData = []; for (let line of lines) { if (line.trim () === "" ) { continue ; } const [key, value] = line.split (":" ).map ((item ) => item.trim ()); const count = Number (key.replace ("个贡献" , "" )); const date = new Date (value.replace (/-/g , "/" )); let color = "#eeeeee" ; if (count > 15 ) { color = "#1e6823" ; } else if (count > 10 ) { color = "#44a340" ; } else if (count > 5 ) { color = "#8cc665" ; } else if (count > 0 ) { color = "#d6e685" ; } jsonData.push ({ count, date, color }); } resolve (jsonData); } else { reject (); } }); } const importTxtDataToJSON = (path ) => { return new Promise ((resolve, reject ) => { const promise = importTxtFile(path); promise.then ((res ) => { resolve (res); }); }); }; let cache = null ;async function getData (toDate = new Date () ) { if (!cache) { cache = await importTxtDataToJSON("./gitee-contribution.txt" ); } return cache; }
此时的完整代码 这时候的完整代码如下
1
2
3
4
5
6
7
8
9
10
11
12
13
14
15
16
17
18
19
20
21
22
23
24
25
26
27
28
29
30
31
32
33
34
35
36
37
38
39
40
41
42
43
44
45
46
47
48
49
50
51
52
53
54
55
56
57
58
59
60
61
62
63
64
65
66
67
68
69
70
71
72
73
74
75
76
77
78
79
80
81
82
83
84
85
86
87
88
89
90
91
92
93
94
95
96
97
98
99
100
101
102
103
104
105
106
107
108
109
110
111
112
113
114
115
116
117
118
119
120
121
122
123
124
125
126
127
128
129
130
131
132
133
134
135
136
137
138
139
140
141
142
143
144
145
146
147
148
<!DOCTYPE html > <html lang ="en" > <head > <meta charset ="UTF-8" /> <meta name ="viewport" content ="width=device-width, initial-scale=1.0" /> <title > Gitee Contributions</title > <style > body { display : flex; justify-content : center; align-items : center; } #stage { width : 1000px ; height : 800px ; } </style > </head > <body > <script src ="https://d3js.org/d3.v5.js" > </script > <div id ="stage" > </div > <script type ="module" > function importTxtFile (filePath, name, charsetType = "GBK" ) { return new Promise ((resolve, reject ) => { const xhr = new XMLHttpRequest (); xhr.open ( "GET" , `${filePath} ` , false ); xhr.overrideMimeType (`text/plain; charset=${charsetType} ` ); xhr.send (); if (xhr.readyState === 4 && xhr.status === 200 ) { const content = xhr.responseText ; const lines = content.split ("\n" ); const jsonData = []; for (let line of lines) { if (line.trim () === "" ) { continue ; } const [key, value] = line.split (":" ).map ((item ) => item.trim ()); const count = Number (key.replace ("个贡献" , "" )); const date = new Date (value.replace (/-/g , "/" )); let color = "#eeeeee" ; if (count > 15 ) { color = "#1e6823" ; } else if (count > 10 ) { color = "#44a340" ; } else if (count > 5 ) { color = "#8cc665" ; } else if (count > 0 ) { color = "#d6e685" ; } jsonData.push ({ count, date, color }); } resolve (jsonData); } else { reject (); } }); } const importTxtDataToJSON = (path ) => { return new Promise ((resolve, reject ) => { const promise = importTxtFile(path); promise.then ((res ) => { resolve (res); }); }); }; import { Scene } from "https://unpkg.com/spritejs/dist/spritejs.esm.js" ; import { Cube , Light , shaders, } from "https://unpkg.com/sprite-extend-3d/dist/sprite-extend-3d.esm.js" ; let cache = null ; async function getData (toDate = new Date () ) { if (!cache) { cache = await importTxtDataToJSON("./gitee-contribution.txt" ); } return cache; } (async function ( const container = document .getElementById ("stage" ); const scene = new Scene ({ container, displayRatio : 2 , }); const layer = scene.layer3d ("fglayer" , { ambientColor : [0.5 , 0.5 , 0.5 , 1 ], camera : { fov : 35 , }, }); layer.camera .attributes .pos = [2 , 6 , 9 ]; layer.camera .lookAt ([0 , 0 , 0 ]); const program = layer.createProgram ({ vertex : shaders.GEOMETRY .vertex , fragment : shaders.GEOMETRY .fragment , }); const dataset = await getData (); const max = d3.max (dataset, (a ) => { return a.count ; }); const selection = d3.select (layer); const chart = selection .selectAll ("cube" ) .data (dataset) .enter () .append (() => { return new Cube (program); }) .attr ("width" , 0.14 ) .attr ("depth" , 0.14 ) .attr ("height" , 1 ) .attr ("scaleY" , (d ) => { return d.count / max; }) .attr ("pos" , (d, i ) => { const x0 = -3.8 + 0.0717 + 0.0015 ; const z0 = -0.5 + 0.05 + 0.0015 ; const x = x0 + 0.143 * Math .floor (i / 7 ); const z = z0 + 0.143 * (i % 7 ); return [x, (0.5 * d.count ) / max, z]; }) .attr ("colors" , (d, i ) => { return d.color ; }); })(); </script > </body > </html >
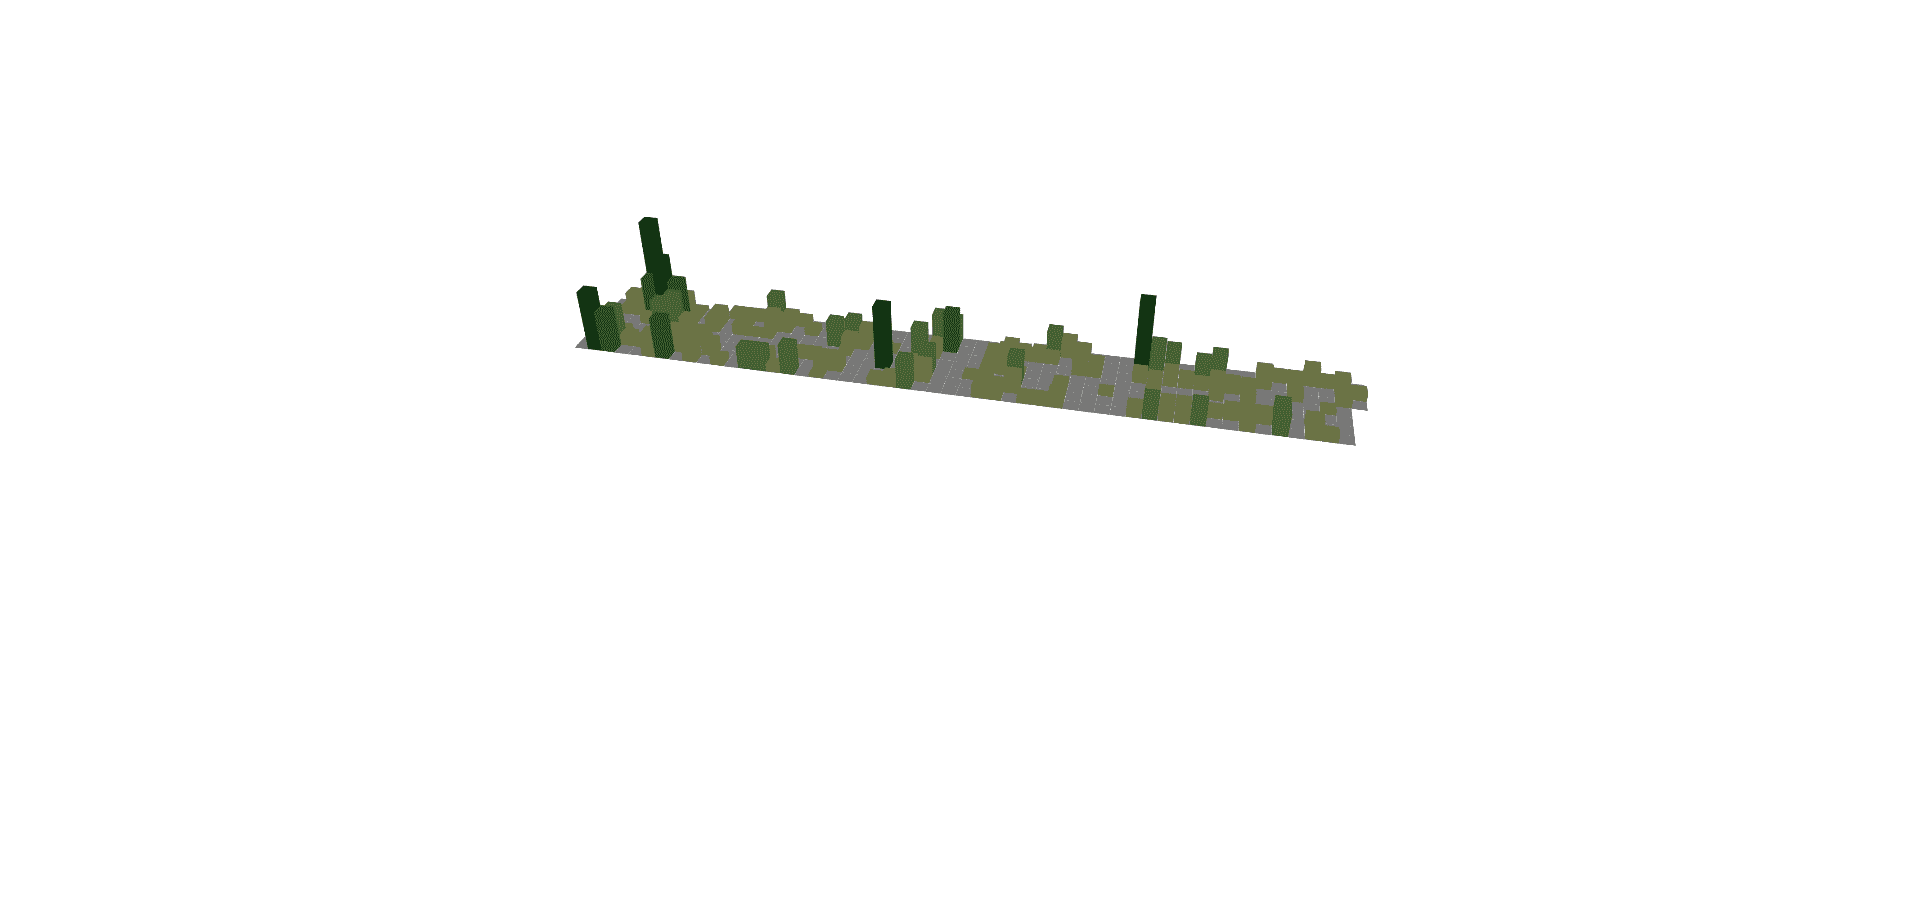
此时的效果
添加光源和控制轴 我们加上光源和控制 3D 旋转的轴
控制轴 1 2 3 layer.setOrbit (); window .layer = layer;
光源 1 2 3 4 5 6 const light = new Light ({ direction : [-3 , -3 , -1 ], color : [1 , 1 , 1 , 1 ], }); layer.addLight (light);
效果 Your browser does not support the video tag.
给柱状图增加一个底座 1 2 3 4 5 6 7 8 9 10 11 12 13 14 15 16 17 18 19 20 21 22 23 24 25 26 27 28 const fragment = ` precision highp float; precision highp int; varying vec4 vColor; varying vec2 vUv; void main() { float x = fract(vUv.x * 53.0); float y = fract(vUv.y * 7.0); x = smoothstep(0.0, 0.1, x) - smoothstep(0.9, 1.0, x); y = smoothstep(0.0, 0.1, y) - smoothstep(0.9, 1.0, y); gl_FragColor = vColor * (x + y); } ` ;const axisProgram = layer.createProgram ({ vertex : shaders.TEXTURE .vertex , fragment, }); const ground = new Cube (axisProgram, { width : 7.6 , height : 0.1 , y : -0.049 , depth : 1 , colors : "rgba(0, 0, 0, 0.1)" , }); layer.append (ground);
上面的代码不复杂,我想重点解释其中两处。首先是片元着色器代码,我们使用了根据纹理坐标来实现重复图案的技术。其次,我们将底座的高度设置为 0.1,y 的值本来应该是 -0.1 的一半,也就是 -0.05,但是我们设置为了 -0.049。少了 0.001 是为了让上层的柱状图稍微“嵌入”到底座里,从而避免因为底座上部和柱状图底部的 z 坐标一样,导致渲染的时候由于次序问题出现闪烁,这个问题在图形学术语里面有一个名字叫做 z-fighting。
添加过渡动画 最后,为了让实现出来的图形更有趣,我们再增加一个过渡动画,让柱状图的高度从不显示,到慢慢显示出来。
1 2 3 4 5 6 7 8 9 10 11 12 13 14 15 16 17 18 19 20 21 22 23 24 25 26 27 28 29 30 31 32 33 const chart = selection .selectAll ("cube" ) .data (dataset) .enter () .append (() => { return new Cube (program); }) .attr ("width" , 0.14 ) .attr ("depth" , 0.14 ) .attr ("height" , 1 ) .attr ("scaleY" , 0.001 ) .attr ("pos" , (d, i ) => { const x0 = -3.8 + 0.0717 + 0.0015 ; const z0 = -0.5 + 0.05 + 0.0015 ; const x = x0 + 0.143 * Math .floor (i / 7 ); const z = z0 + 0.143 * (i % 7 ); return [x, 0 , z]; }) .attr ("colors" , (d, i ) => { return d.color ; }); const linear = d3.scaleLinear ().domain ([0 , max]).range ([0 , 1.0 ]);chart .transition () .duration (2000 ) .attr ("scaleY" , (d, i ) => { return linear (d.count ); }) .attr ("y" , (d, i ) => { return 0.5 * linear (d.count ); });
最终效果 Your browser does not support the video tag.
结语 这个案例还有很多可以完善的空间,比如对齐的问题,因为我爬数据的时候把空的box给干掉了,原始的dom里面是有的,所以看起来和gitee有点对不上。然后可以加上一些图示和注解,让3D图看起来更加容易理解,这个就交给大家发挥了,大家要是感兴趣也可以用three来实现,可以参考我之前的three-3d 图表的文章。本篇文章就先到这里了,更多内容敬请期待,债见~
