前言
本篇文章记录一下我最近搞的谷歌地图,因为公司要做外国项目,免费的天地图没法使用,加上谷歌地图的 UI 我还是比较喜欢的,而且每个月免费额度挺多的,就稍微研究了一下。
注册谷歌地图 API
这个我不多说,你需要翻墙和一张海外的卡。然后可以得到一个 key。
得到 URL
这里的??就是你的 key,后面的 maps 和 marker 是我要用到的插件,maps 用来绘图,marker 是标记。
此时你会得到一个 URL’https://maps.googleapis.com/maps/api/js?key=??&libraries=maps,marker‘;
异步加载地图
常规加载
我们一般情况下是直接在 html 文件中引入就可以了
1
2
3
4
5
| <script
src="https://maps.googleapis.com/maps/api/js?key=??&libraries=maps,marker"
defer
async
></script>
|
异步加载
但是我想要能在页面中切换,所以我需要异步导入,这里以英语和中文为例,此时代码如下
1
2
3
4
5
6
7
8
9
| const BASE_GOOLE_URL =
"https://maps.googleapis.com/maps/api/js?key=??&libraries=maps,marker";
let loadUrl = BASE_GOOLE_URL;
if (locale.value === "en_US") {
loadUrl += "&language=en";
} else if (locale.value === "zh_CN") {
loadUrl += "&language=zh-CN";
}
|
更多语言
如果需要其他的语言,可以参考:https://developers.google.cn/admin-sdk/directory/v1/languages?hl=en
异步加载方法
为了避免重复加载,加了个 id,有这个 id 了就不再加载
1
2
3
4
5
6
7
8
9
10
11
12
13
14
15
16
17
18
19
20
21
22
23
24
25
26
27
28
|
export function loadGoogleScript(url) {
return new Promise((resolve, reject) => {
const googleMapScript = document.getElementById("googleMapScript");
if (googleMapScript) {
if (googleMapScript.src === url) {
return resolve("loading success");
} else {
googleMapScript.remove();
}
}
const script = document.createElement("script");
script.src = url;
script.defer = true;
script.id = "googleMapScript";
script.onload = () => {
resolve("loading success");
};
script.onerror = (error) => {
console.error("Error loading lib from " + url, error);
reject(error);
};
document.head.appendChild(script);
});
}
|
初始化地图
1
2
3
4
5
6
7
8
9
10
11
12
13
14
15
16
17
18
19
20
21
22
23
24
25
26
27
28
29
30
31
32
33
34
| let temp;
let googleMap;
const siteMapContainer = ref();
const initMap = async () => {
center.lat = 0;
center.lng = 0;
const windowTemp = window;
if (!windowTemp.google) {
NotifyPlugin.error({
title: "Maps API not loaded",
});
return;
}
temp = windowTemp.google;
googleMap = new temp.maps.Map(siteMapContainer.value, {
center: { lat: 30.2, lng: 120.4 },
zoom: 3,
mapId: "DEMO_MAP_ID",
minZoom: 3,
maxZoom: 10,
zoomControl: true,
streetViewControl: false,
cameraControl: false,
fullscreenControl: false,
mapTypeControl: false,
});
};
onMounted(() => {
initMap();
});
|
1
2
3
| <template>
<div ref="siteMapContainer" id="siteMapContainer"></div>
</template>
|
这里的控件,你可以按照你的喜好调整,可以参考:https://developers.google.cn/maps/documentation/javascript/reference/control?hl=zh_cn
此时完整代码如下:
1
2
3
4
5
6
7
8
9
10
11
12
13
14
15
16
17
18
19
20
21
22
23
24
25
26
27
28
29
30
31
32
33
34
35
36
37
38
39
40
41
42
43
44
45
46
47
48
49
50
51
52
53
54
55
56
57
58
59
60
61
62
63
64
65
66
67
68
69
70
71
72
73
74
75
76
77
78
79
80
81
82
83
84
85
86
87
88
89
90
91
92
93
94
95
| <script setup>
import { onMounted, ref } from "vue";
const locale = ref("zh_CN");
const BASE_GOOLE_URL =
"https://maps.googleapis.com/maps/api/js?key=??&libraries=maps,marker";
let loadUrl = BASE_GOOLE_URL;
if (locale.value === "en_US") {
loadUrl += "&language=en";
} else if (locale.value === "zh_CN") {
loadUrl += "&language=zh-CN";
}
function loadGoogleScript(url) {
return new Promise((resolve, reject) => {
const googleMapScript = document.getElementById("googleMapScript");
if (googleMapScript) {
if (googleMapScript.src === url) {
return resolve("loading success");
} else {
googleMapScript.remove();
}
}
const script = document.createElement("script");
script.src = url;
script.defer = true;
script.id = "googleMapScript";
script.onload = () => {
resolve("loading success");
};
script.onerror = (error) => {
console.error("Error loading lib from " + url, error);
reject(error);
};
document.head.appendChild(script);
});
}
let temp;
let googleMap;
let center = { lat: 0, lng: 0 };
const siteMapContainer = ref();
const initMap = async () => {
center.lat = 0;
center.lng = 0;
const windowTemp = window;
if (!windowTemp.google) {
NotifyPlugin.error({
title: "Maps API not loaded",
});
return;
}
temp = windowTemp.google;
googleMap = new temp.maps.Map(siteMapContainer.value, {
center: { lat: 30.2, lng: 120.4 },
zoom: 3,
mapId: "DEMO_MAP_ID",
minZoom: 3,
maxZoom: 10,
zoomControl: true,
streetViewControl: false,
cameraControl: false,
fullscreenControl: false,
mapTypeControl: false,
});
};
onMounted(async () => {
await loadGoogleScript(loadUrl);
initMap();
});
</script>
<template>
  <div ref="siteMapContainer" id="siteMapContainer"></div>
</template>
<style scoped>
#siteMapContainer {
height: 100vh;
width: 100%;
display: block;
position: relative;
}
</style>
|
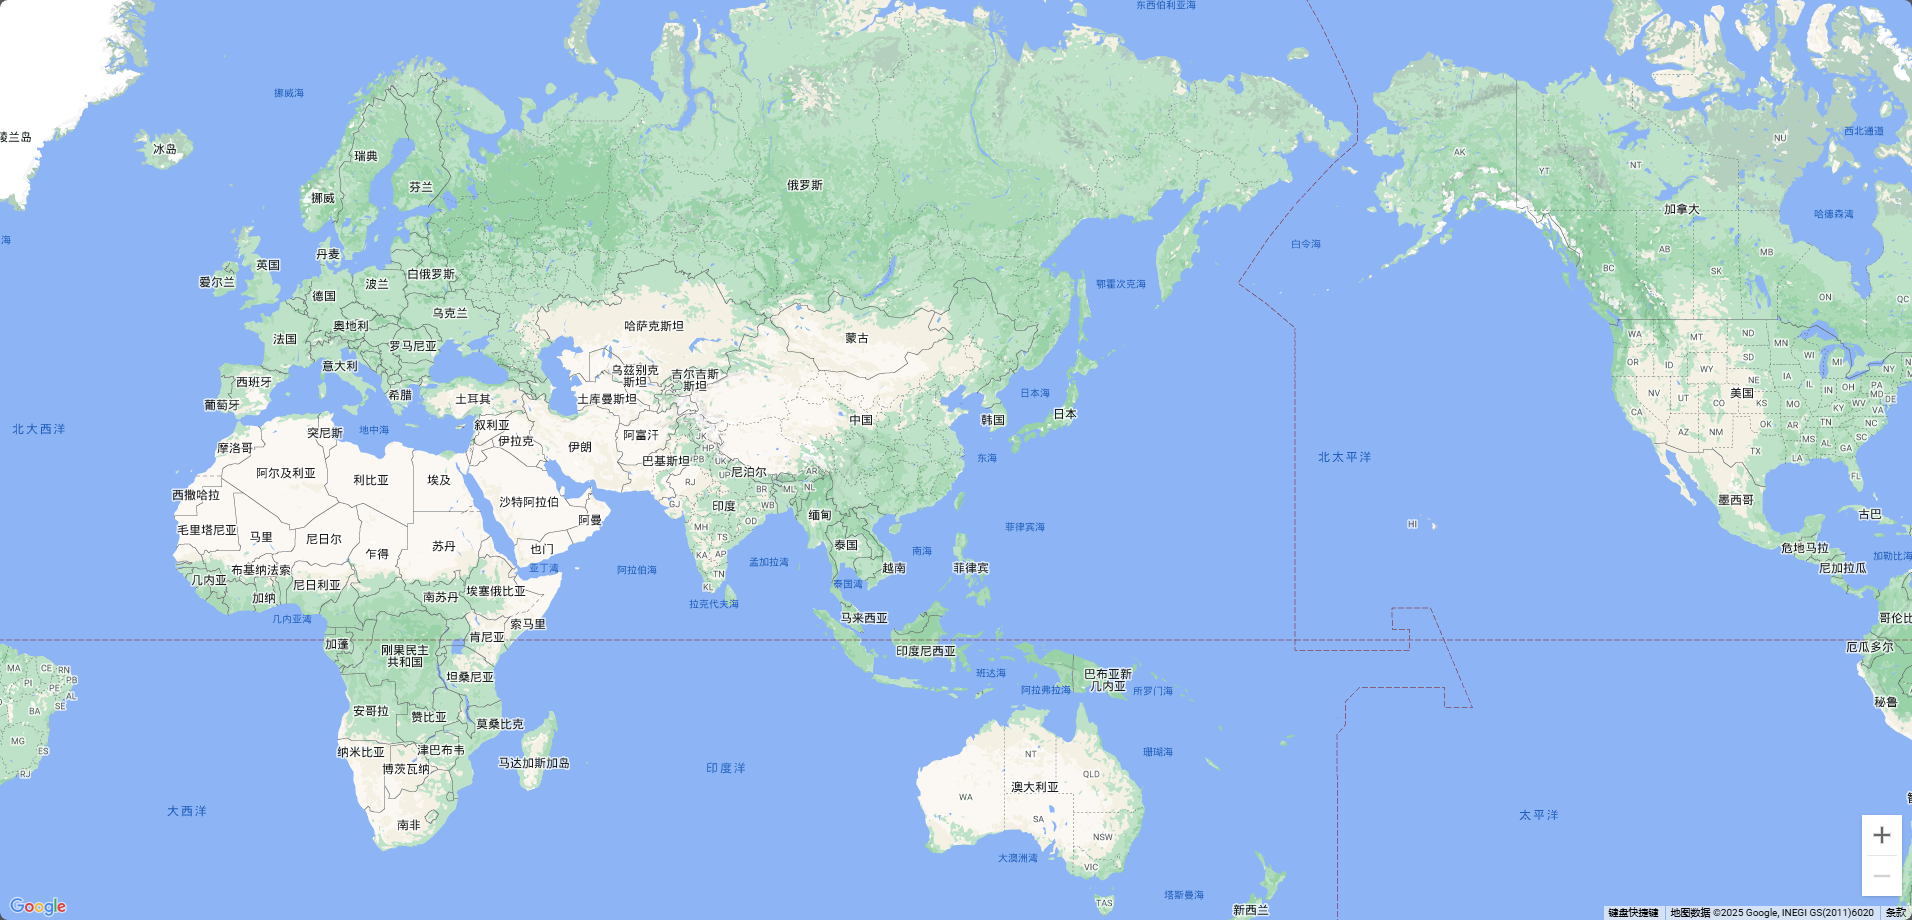
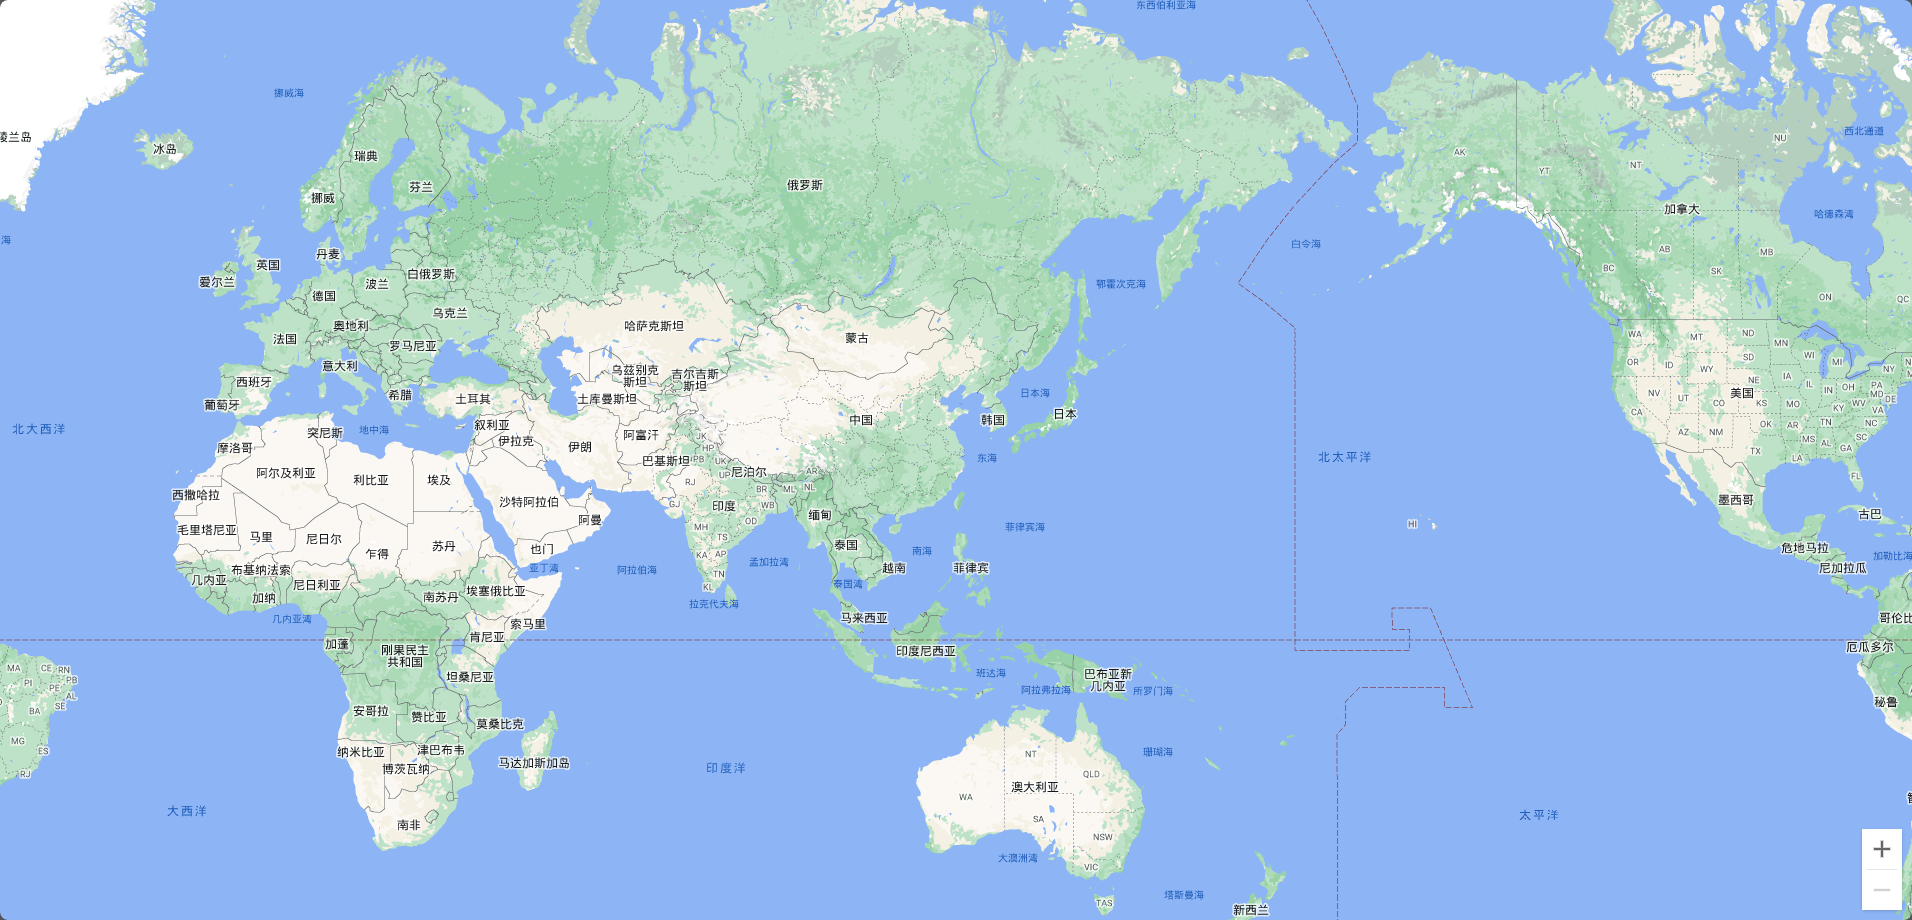
这里,我们已经可以将谷歌地图加载出来了
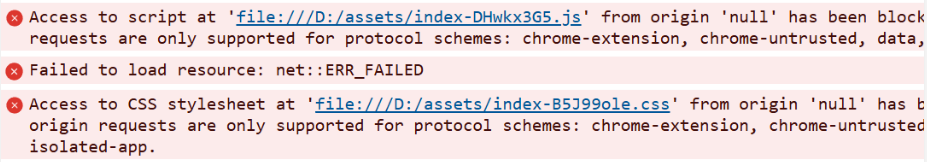
去除无效 logo
这时候我们已经加载完地图了,但是左下角右下角有一些 logo,我们可以自己设置 css 给它干掉
1
2
3
4
5
6
7
8
| #siteMapContainer .gm-style-cc {
display: none;
}
#siteMapContainer {
a {
display: none !important;
}
}
|
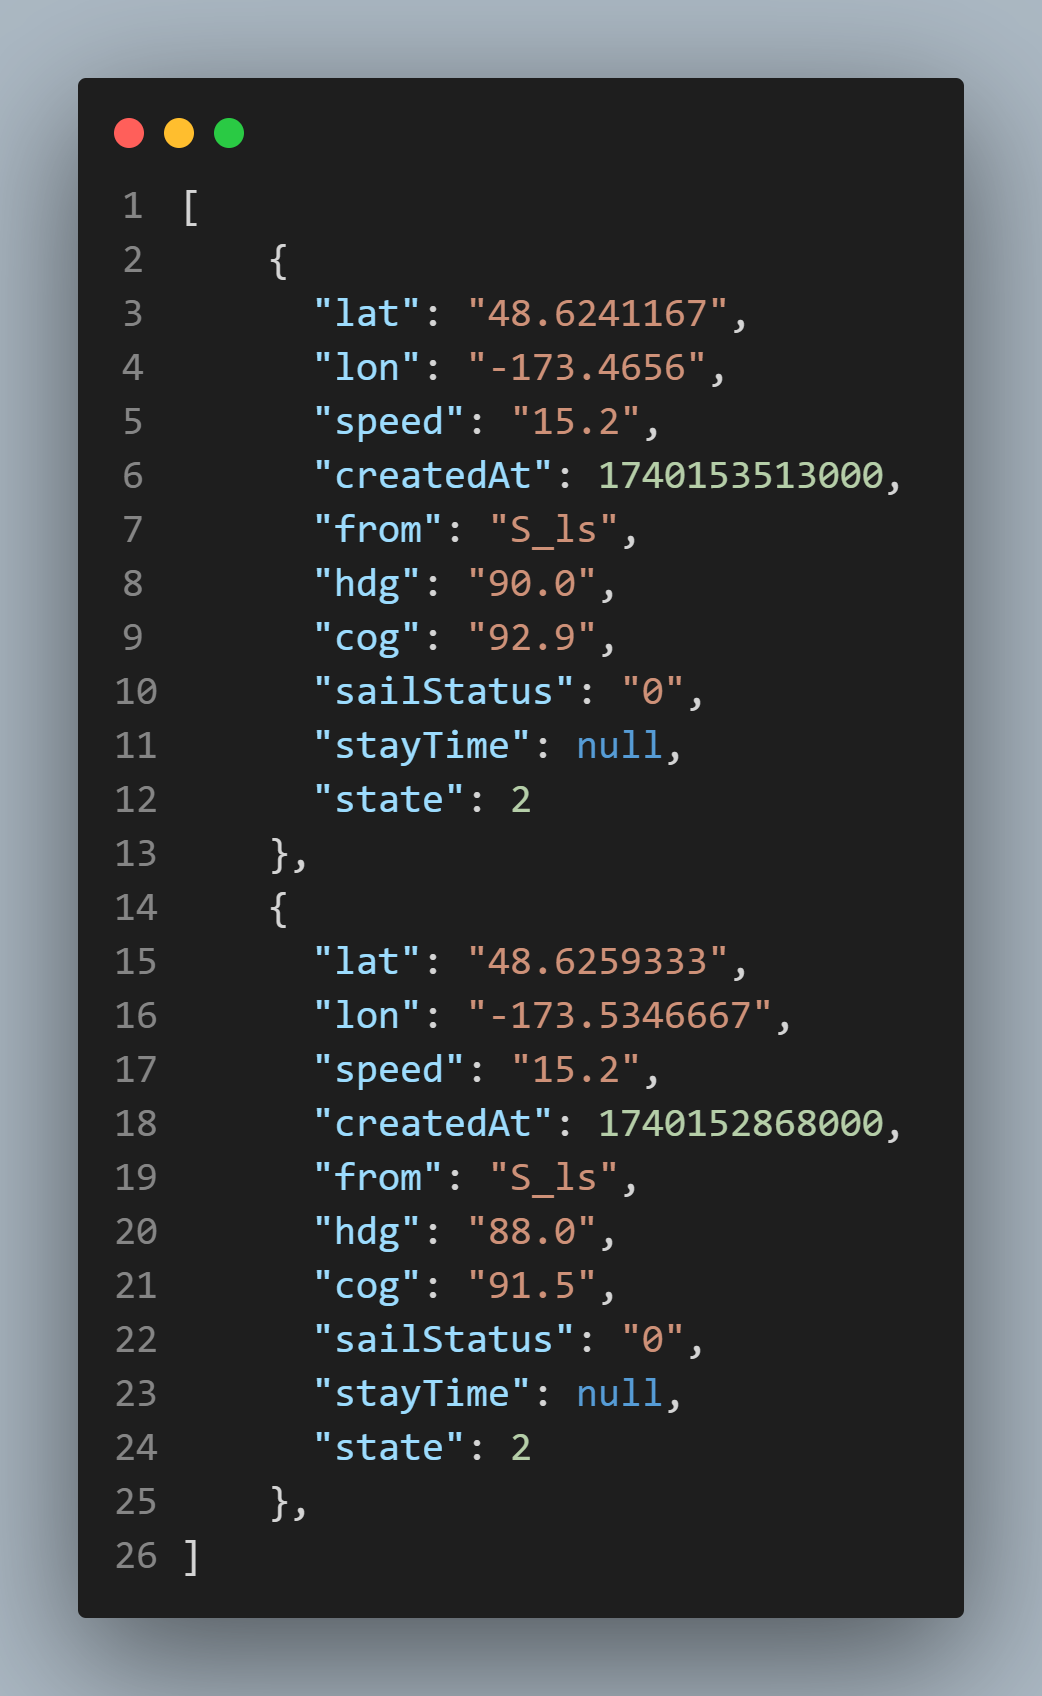
json 格式
我项目里面自然是发请求得到 JSON 的,这里我就不拿出接口了,给大家看看 json 的格式即可
添加 markers 和 line
因为我的线是多段的,所以我有一些特殊处理,怕大家看不懂,我先把这段处理代码贴上来,如果大家自己绘制不是多段的可以不用这样,我的轨迹是最新的在前面,所以为了得到真正的首尾节点,我需要 reverse 一下。
处理 markers
1
2
3
4
5
6
7
8
9
10
11
12
13
14
| const markers = ref([]);
const drawMarkers = (trackList) => {
trackList.reverse().forEach((item, index) => {
const { lon, lat } = item;
if (index === 0 || index === trackList.length - 1) {
markers.value.push({
position: { lat: Number(lat), lng: Number(lon) },
...item,
});
}
});
};
|
绘制线
将我们的 trackList 传入,即可绘制线
1
2
3
4
5
6
7
8
9
10
11
12
13
14
15
16
17
18
19
20
21
22
23
24
25
26
27
28
29
30
31
32
33
34
35
36
37
38
39
40
41
42
43
44
45
46
47
|
const drawLines = async (trackList) => {
const { Polyline } = await temp.maps.importLibrary("maps");
const path = trackList.map((item) => ({
lat: Number(item.lat),
lng: Number(item.lon),
}));
const polyline = new Polyline({
path,
geodesic: true,
strokeColor: "#FF0000",
strokeOpacity: 1.0,
strokeWeight: 2,
map: googleMap,
icons: [
{
icon: {
path: temp.maps.SymbolPath.CIRCLE,
scale: 0,
},
offset: "0%",
},
{
icon: { path: temp.maps.SymbolPath.FORWARD_CLOSED_ARROW },
offset: "20%",
},
{
icon: { path: temp.maps.SymbolPath.FORWARD_CLOSED_ARROW },
offset: "40%",
},
{
icon: { path: temp.maps.SymbolPath.FORWARD_CLOSED_ARROW },
offset: "60%",
},
{
icon: { path: temp.maps.SymbolPath.FORWARD_CLOSED_ARROW },
offset: "80%",
},
],
});
return {
path,
polyline,
};
};
|
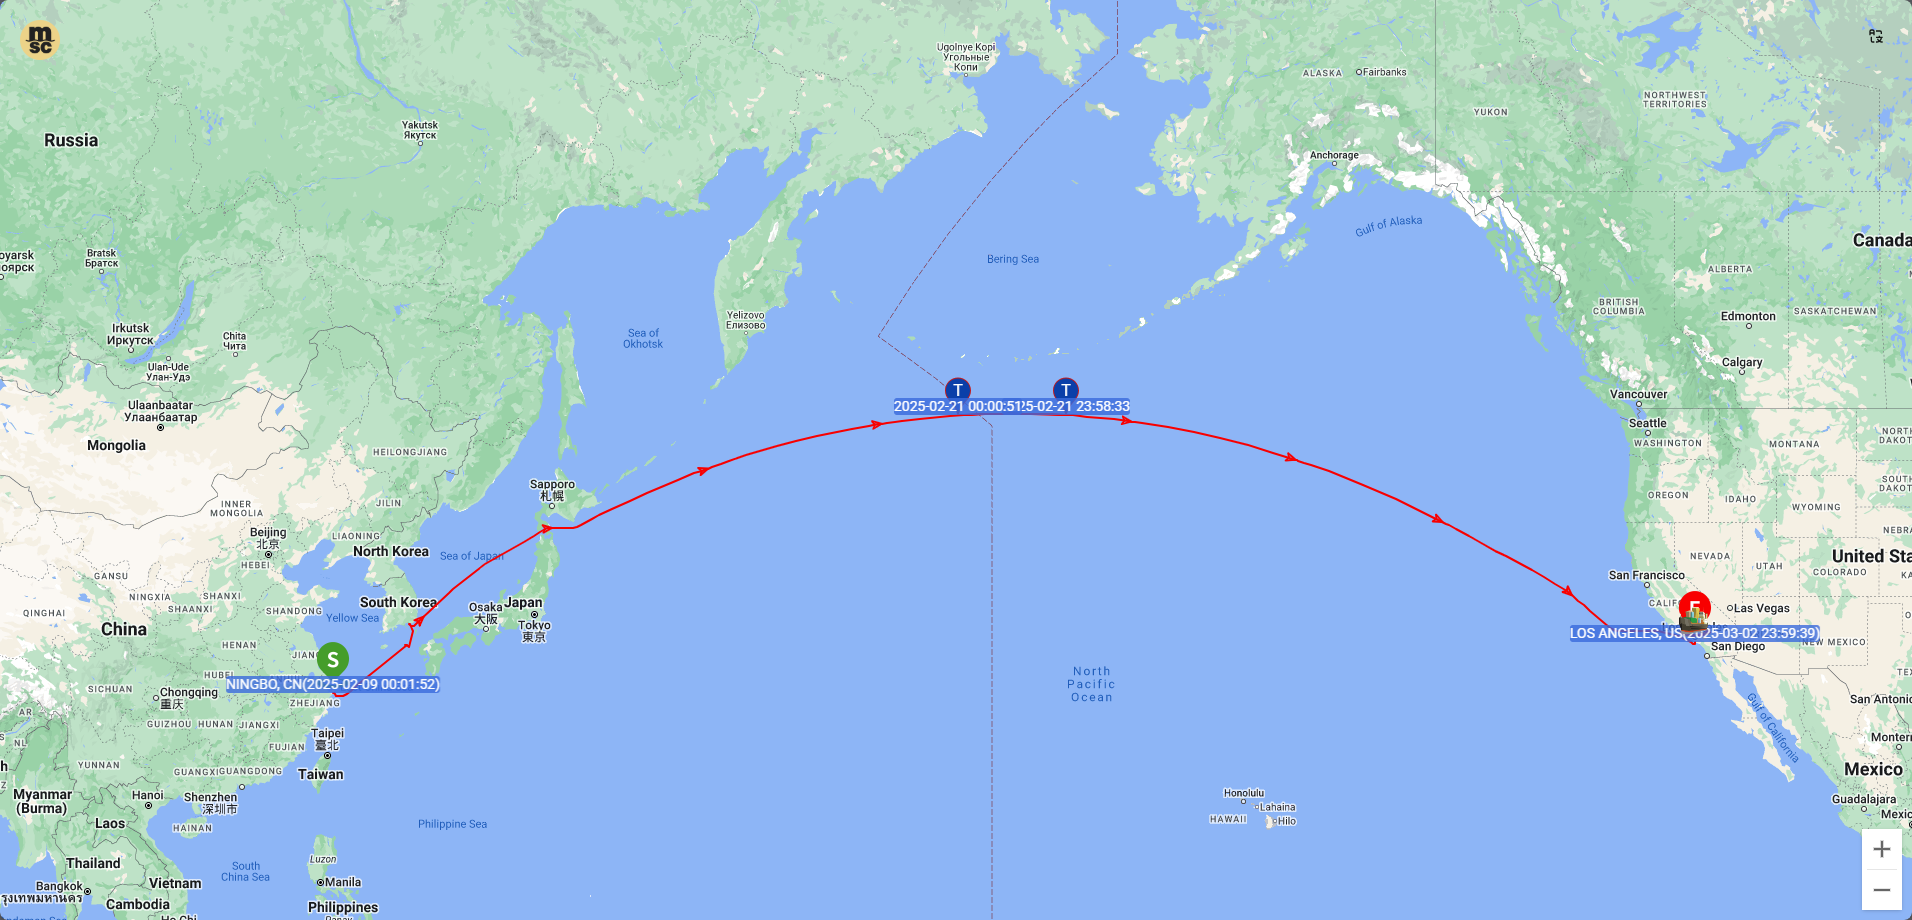
此时效果图如下

上面的 icons 我简单说一下,因为我想要带箭头的轨迹线,所以在 20,40,60,80 的地方加了箭头,又因为我后续要加图标沿着轨迹线运动,所以在 0%的地方预留了这个 icon 的位置
这里给大家贴一个网址,绘制谷歌地图自带的 svg 样式的:https://developers.google.cn/maps/documentation/javascript/examples/overlay-symbol-arrow?hl=en
调整中心点
谷歌地图自带 setCenter 方法,可以调整中心点
1
2
3
4
5
6
7
8
9
10
11
12
|
if (!isEmpty(allList)) {
allList.forEach((item: any) => {
center.lat += Number(item.lat);
center.lng += Number(item.lon);
});
googleMap.setCenter({
lat: center.lat / allList.length,
lng: center.lng / allList.length,
});
}
|
绘制标记
这里给大家介绍俩种方法,一种是自己的图片,一种是谷歌地图自带的标记,自带的就是自己设置样式,创建 img 标签传给谷歌地图,如果想要添加文字的话也可以这样操作,添加 class 后,自己定义样式。如果是谷歌自带的标记,就很简单了,配置一些参数即可,这里给大家贴一个谷歌地图自带标记配置的网址:https://developers.google.cn/maps/documentation/javascript/examples/advanced-markers-basic-style?hl=en
1
2
3
4
5
6
7
8
9
10
11
12
13
14
15
16
17
18
19
20
21
22
23
24
25
26
27
28
29
30
31
32
33
34
35
36
37
38
39
40
41
42
43
44
45
46
47
48
49
50
51
52
53
54
55
56
57
58
59
60
61
62
63
64
65
66
67
68
69
70
71
72
73
74
75
76
77
78
79
80
81
82
83
84
85
86
87
88
89
90
91
92
93
94
95
96
97
98
| if (!isEmpty(markers.value)) {
const startImg = document.createElement("img");
startImg.src = new URL("@/assets/track/start.png", import.meta.url).href;
startImg.style.width = "50px";
const endImg = document.createElement("img");
endImg.src = new URL("@/assets/track/end.png", import.meta.url).href;
endImg.style.width = "50px";
const curImg = document.createElement("img");
curImg.src = new URL("@/assets/track/cur.png", import.meta.url).href;
curImg.style.width = "40px";
const startPort = props.detailInfo[0].shipFrom;
const endPort = props.detailInfo[0].shipTo;
markers.value.forEach((item, index) => {
if (index == 0) {
new AdvancedMarkerElement({
map: googleMap,
position: item.position,
title: "Start",
content: startImg,
});
const _div = document.createElement("div");
_div.className = "text";
_div.textContent =
startPort +
`(` +
dayjs(Number(item.createdAt)).format("YYYY-MM-DD HH:mm:ss") +
")";
new AdvancedMarkerElement({
map: googleMap,
position: item.position,
content: _div,
});
} else if (index == markers.value.length - 1) {
const firstRoute = props.detailInfo[0].ctnLogs;
const lastTime = firstRoute[firstRoute.length - 1].actTime;
const isLastTime =
lastTime && dayjs(lastTime).valueOf() > dayjs().valueOf();
const _div = document.createElement("div");
_div.className = "text";
if (isLastTime) {
new AdvancedMarkerElement({
map: googleMap,
position: item.position,
title: "Current",
content: curImg,
});
_div.textContent = dayjs(Number(item.createdAt)).format(
"YYYY-MM-DD HH:mm:ss"
);
} else {
new AdvancedMarkerElement({
map: googleMap,
position: item.position,
title: "End",
content: endImg,
});
_div.textContent =
endPort +
`(` +
dayjs(Number(item.createdAt)).format("YYYY-MM-DD HH:mm:ss") +
")";
}
new AdvancedMarkerElement({
map: googleMap,
position: item.position,
content: _div,
});
} else {
const pinTextGlyph = new PinElement({
glyph: "T",
glyphColor: "white",
background: "#003cab",
});
new AdvancedMarkerElement({
map: googleMap,
position: item.position,
title: "T/S",
content: pinTextGlyph.element,
});
const _div = document.createElement("div");
_div.className = "text";
_div.textContent = dayjs(Number(item.createdAt)).format(
"YYYY-MM-DD HH:mm:ss"
);
new AdvancedMarkerElement({
map: googleMap,
position: item.position,
content: _div,
});
}
});
}
|
1
2
3
4
5
6
7
8
9
10
11
12
13
14
15
16
17
18
19
20
21
22
23
24
25
26
27
28
29
30
31
32
33
| #siteMapContainer {
a {
display: none !important;
}
.text {
background-color: #3567dfcc;
color: #fff;
font-size: 14px;
border-radius: 3px;
}
/* HTML marker styles */
.tag {
background-color: #4285f4;
border-radius: 8px;
color: #ffffff;
font-size: 14px;
padding: 10px 15px;
position: relative;
}
.tag::after {
content: '';
position: absolute;
left: 50%;
top: 100%;
transform: translate(-50%, 0);
width: 0;
height: 0;
border-left: 8px solid transparent;
border-right: 8px solid transparent;
border-top: 8px solid #4285f4;
}
}
|
此时轨迹线和标记都打上了
添加沿轨迹运动的小船
然后我们添加沿轨迹运动的小船
1
2
3
4
5
6
7
8
9
10
11
12
13
14
15
16
17
18
19
20
21
22
23
24
25
26
27
28
29
30
31
32
33
34
35
36
37
38
39
40
41
42
43
44
45
46
47
48
49
50
51
52
53
54
55
56
57
58
59
60
61
62
63
64
65
66
67
68
69
70
71
72
73
74
75
76
77
78
79
80
81
82
83
84
85
86
87
88
89
90
91
92
93
94
95
96
97
|
if (allPaths.length > 0) {
const shipIcon = document.createElement("img");
const shipImg = new URL("@/assets/track/ship.png", import.meta.url).href;
shipIcon.src = shipImg;
shipIcon.style.width = "32px";
shipIcon.style.height = "32px";
const { spherical } = await temp.maps.importLibrary("geometry");
const startPoint = allPaths[0];
const nextPoint = allPaths[1];
const initialHeading = spherical.computeHeading(
new temp.maps.LatLng(startPoint.lat, startPoint.lng),
new temp.maps.LatLng(nextPoint.lat, nextPoint.lng)
);
const initialRotation =
initialHeading < -90 || initialHeading > 90 ? 90 : -90;
shipIcon.style.transform = `rotate(${initialRotation}deg)`;
const shipMarker = new AdvancedMarkerElement({
map: googleMap,
content: shipIcon,
});
let start: number | null = null;
const duration = 8000;
let animateNum = 0;
const startAnimateTime = Number(allList[0].createdAt);
const endAnimateTime = Number(allList[allList.length - 1].createdAt);
let animateIndex = 0;
const animate = (timestamp: number) => {
if (!start) start = timestamp;
const progress = (timestamp - start) / duration;
if (progress >= 1) {
cancelAnimationFrame(animateNum);
emits("showInfo", true);
shipIcon.style.transform = `rotate(0deg)`;
if (splitPaths.length > 1) {
const bounds = new temp.maps.LatLngBounds();
[...splitPaths[splitPaths.length - 1]].forEach((item) => {
bounds.extend(new temp.maps.LatLng(item.lat, item.lng));
});
googleMap.fitBounds(bounds);
}
shipMarker.position = allPaths[allPaths.length - 1];
return;
}
const currentTime =
startAnimateTime + progress * (endAnimateTime - startAnimateTime);
const currentIndex = allList.findIndex((item: any, index: number) => {
if (index < animateIndex) {
return false;
}
return Number(item.createdAt) >= currentTime;
});
const currentPosition = allPaths[currentIndex];
if (currentPosition) {
shipMarker.position = currentPosition;
if (currentIndex < allPaths.length - 1) {
const nextPosition = allPaths[currentIndex + 1];
const heading = spherical.computeHeading(
new temp.maps.LatLng(currentPosition.lat, currentPosition.lng),
new temp.maps.LatLng(nextPosition.lat, nextPosition.lng)
);
const rotation =
heading < -90 || heading > 90 ? heading + 90 : heading - 90;
shipIcon.style.transform = `rotate(${rotation}deg)`;
}
}
animateNum = requestAnimationFrame(animate);
};
const bounds = new temp.maps.LatLngBounds();
allPaths.forEach((item) => {
bounds.extend(new temp.maps.LatLng(item.lat, item.lng));
});
googleMap.fitBounds(bounds);
temp.maps.event.addListenerOnce(googleMap, "idle", function () {
animateNum = requestAnimationFrame(animate);
});
}
|
这里的 allPath 是多段轨迹合并的线段,splitPath 的多段轨迹分开的格式,相当于一个是[…a,…b],另外一个是[[a],[b]],a 和 b 都是上面轨迹格式的数组。
这里我写了个简单的算法,根据轨迹传回来的 createAt 的时间点控制小船的运动速度,停留时间等。
1
2
3
4
| allPaths.forEach((item) => {
bounds.extend(new temp.maps.LatLng(item.lat, item.lng));
});
googleMap.fitBounds(bounds);
|
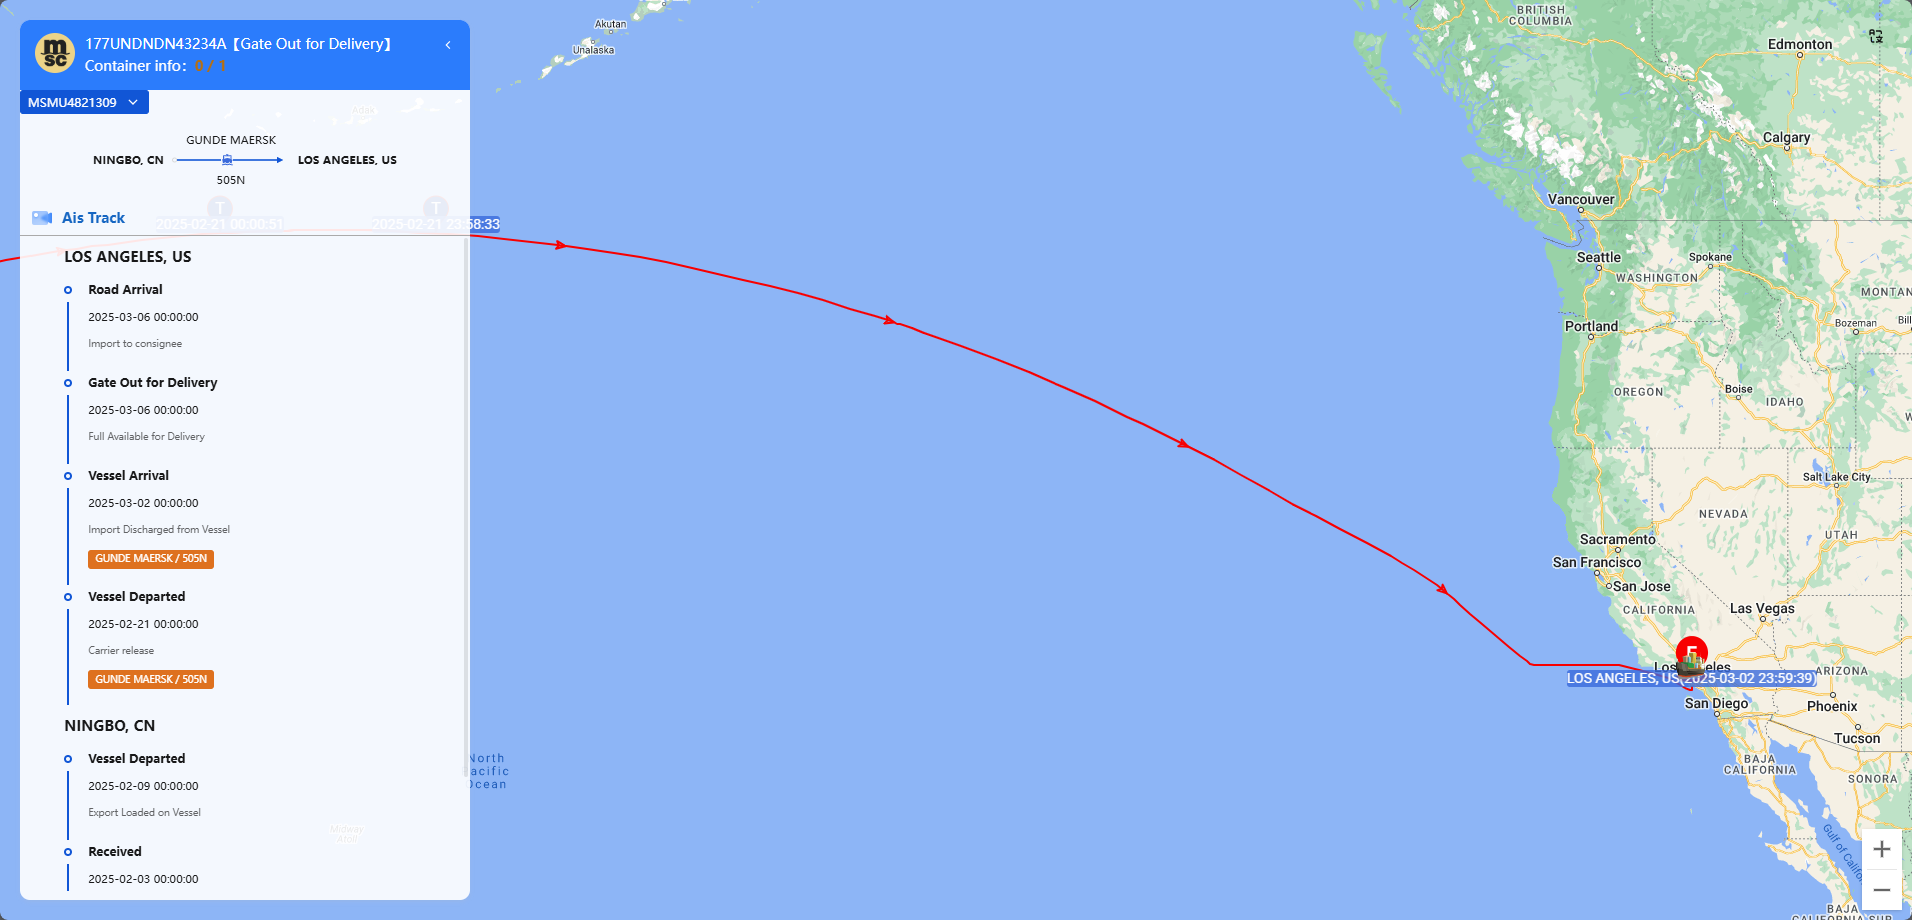
这段代码就是根据这段轨迹线来自动调整地图的比例和中心点位置,这个点谷歌地图倒是让人挺省事的。剩下的都是我自己写的动画帧代码了,最终效果如下。
添加运动节点展示
最后在左侧加上css即可,这里代码就不展示了,注意一个点,zIndex要大一些,不然会显示不了,我通过上面的动画监听得到了轨迹动画结束的时候,这时候传一个showInfo给父组件展示左侧的样式,基本逻辑就是这样。
结语
本篇文章就到这里了,简单记录了一下我用谷歌地图的代码,更多内容敬请期待,债见。